Figure 3.
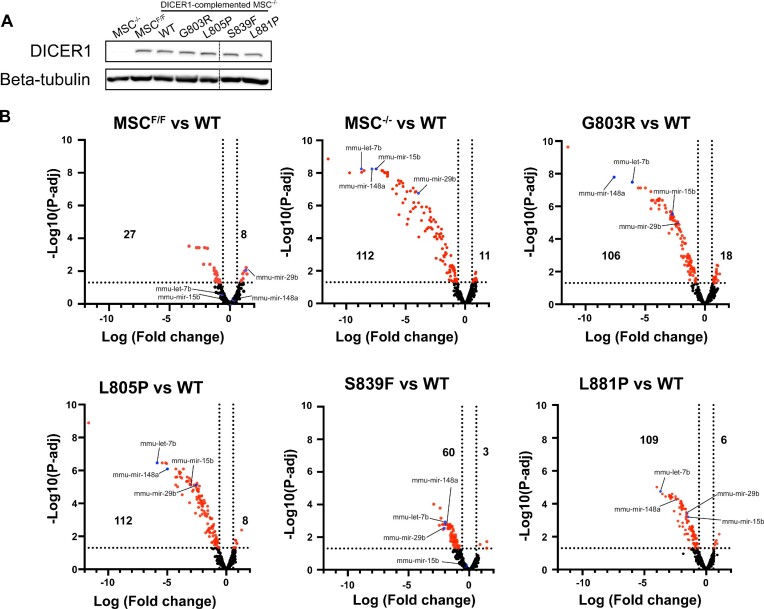
MiRNA profiling of murine mesenchymal stem cells (mMSCs). (A) Western blot of DICER1 protein in mMSCs expressing different DICER1 mutant proteins. (B) Volcano plots depicting differential expression of miRNAs between various cell line compared to WT. Significantly differentiated miRNAs are shown in red. miRNAs used in luciferase assay are shown in blue. Number of significantly differentiated miRNAs are shown on the left (downregulated) or right (upregulated) (n = 3). Data information: In (B), vertical doted lines represent fold change equal to –1.5 or 1.5. Horizontal doted line represents P-adjusted equal to 0.05 (n = 3).

