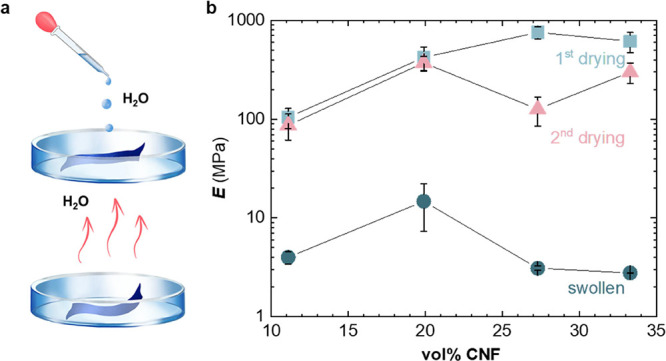
Figure 4.

Water uptake. (a) Schematic of the swelling experiments. (b) Young’s moduli of p(g42T-T):CNF nanocomposites as a function of vol % CNF for initial vacuum-dried samples (blue squares), samples swollen in deionized water (blue circles), and the same samples dried again in vacuum (red triangles). Each data point and error bar represent the mean value and min–max error for measurements of two to four individual samples.
