Figure 5.
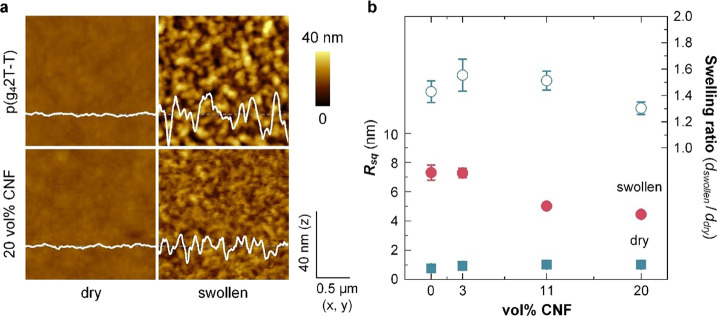
(a) Representative AFM images of neat p(g42T-T) (top) and a nanocomposite film containing 20 vol % CNF (bottom) when dry (left) and swollen, measured while submerged in deionized water (right). Corresponding height profiles are overlayed. Scale-adjusted topography images are depicted in Figure S7. (b) RMS roughness Rsq (left, solid symbol; mean values and standard error from four measurements) of the dry and submerged films and swelling ratio dswollen/ddry (right, open symbol; mean values and standard error of four measurements) as a function of the CNF content.

