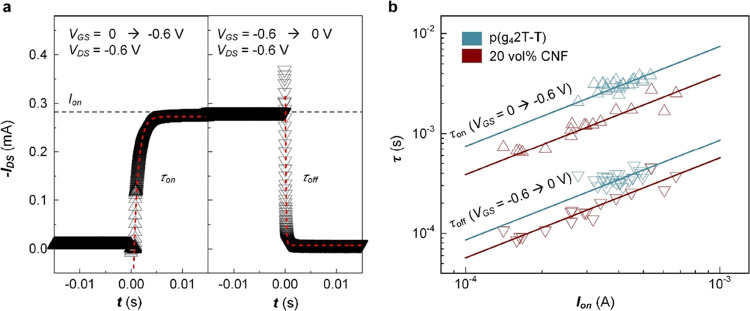
Figure 8.
Transient analysis of OECT devices. (a) Representative plot of the IDS response (triangles: data; dashed lines: exponential fits using eqs 9 and 10) upon application of voltage steps at the gate electrode (left: VGS = 0 to −0.6 V, right: VGS = −0.6 to 0 V). (b) Plot of the time constants τon (upper triangles) and τoff (lower triangles) vs IDS as well as linear fits (solid lines) for devices based on neat p(g42T-T) (blue) and nanocomposites comprising 20 vol % CNF (red).

