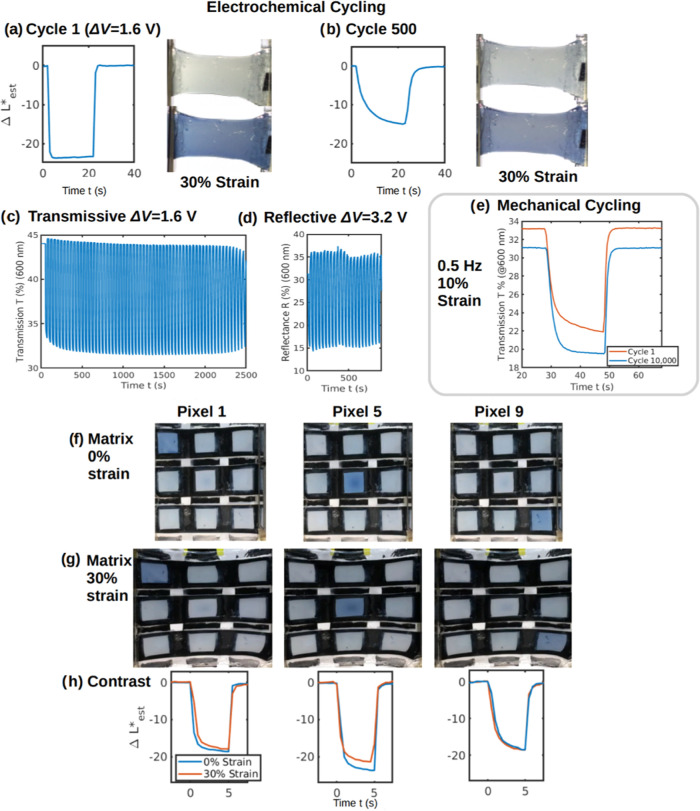
Figure 2.
Cycling stability and matrix display performance. (a) ΔL*est(t) and image cycle 1, (b) ΔL*est(t) and image cycle 500, (c) ΔTmax of transmissive sample cycle 1–60 (0 to +1.6 V for visible electrode), (d) ΔRmax of reflective sample cycle 1–21 (−1.6 to +1.6 V for visible electrode), (e) ΔTmax of a transmissive device at 0 and after 10,000 strain cycles to 10% strain at 0.5 Hz, (f) 3 × 3 matrix operation under 0%, (g) 30% strain, (h) relative contrast change ΔL*est values for select pixels under 0 and 30% strain.

