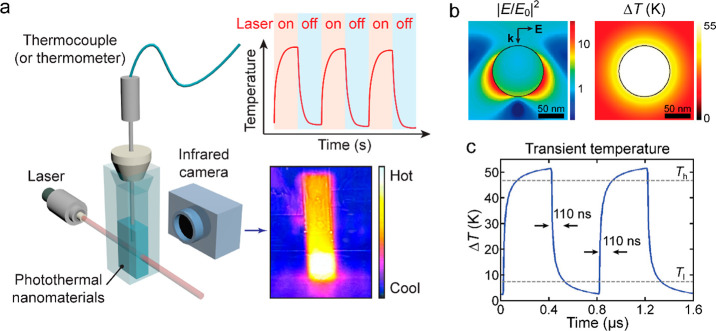
Figure 12.
Macroscopic and microscopic temperature measurements. (a) Schematic diagram of typical photothermal characterization with traditional thermometric techniques. The heating and cooling processes are controlled by switching on and off the laser and monitored with mercury thermometers or thermocouples. The macroscopic temperature distribution can be imaged with an IR camera. (b) Simulation of the photothermal effect of a Au nanosphere (radius, 50 nm) placed in water under an incident light at 530 nm, tuned to the dipole plasmon resonance wavelength. Left: electric field intensity profile normalized to the incident field. Right: equilibrium distribution of the temperature increase. Reprinted with permission from ref (260). Copyright 2010 American Chemical Society. (c) Simulated transient temperature increase of a Au nanosphere (radius, 50 nm) in water excited by on–off modulated light. Th and Tl represent 90% and 10% of the temperature step, respectively, which define the rise and fall time of 110 ns. Reprinted with permission from ref (382). Copyright 2012 American Chemical Society.

