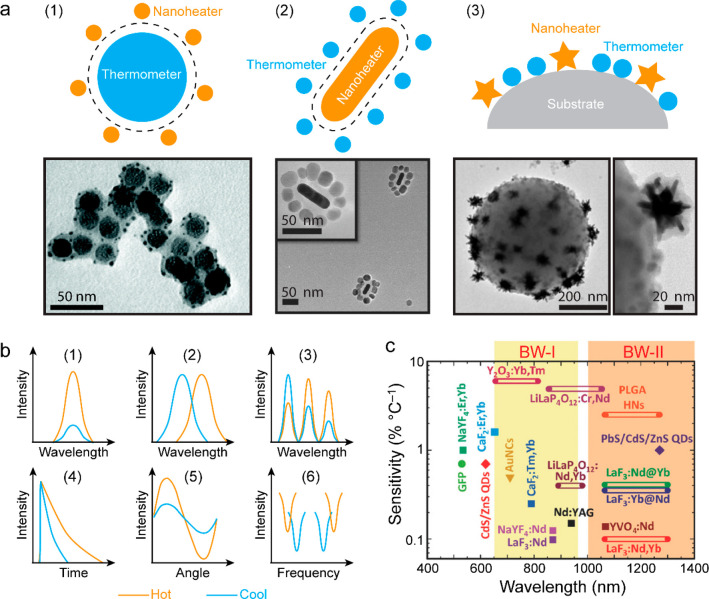
Figure 13.
Nanothermometers for local temperature measurements. (a) Schematics (upper row) illustrating three different configurations for combining nanoheaters and nanothermometers and transmission electron microscopy (TEM) images (lower row) of representative hybrid nanostructures: (1) (NaYF4:Yb,Er up-conversion nanoparticle (UCNP))@(mesoporous silica (mSiO2))-(Au nanoparticle) core–satellite nanoassemblies. Reprinted with permission from ref (394). Copyright 2019 Royal Society of Chemistry. (2) (Au nanorod)-(NaGdF4:Yb,Er UCNP) core–satellite nanoassemblies. Reprinted with permission from ref (397). Copyright 2016 Wiley-VCH. (3) Polystyrene beads attached with Au nanostars and CaF2:Nd3+,Y3+ UCNPs. Reprinted from ref (400). Copyright 2019 Ivyspring International Publisher under the CC BY 4.0 license http://creativecommons.org/licenses/by/4.0/. (b) Illustrations showing temperature-sensing strategies relying on (1) emission intensity, (2) peak position, (3) emission intensity ratio, (4) emission lifetime, (5) fluorescence polarization anisotropy, (6) electron spin resonance or ODMR. (c) Thermal sensitivities of different luminescent nanothermometers and their spectral operation ranges. Reprinted with permission from ref (391). Copyright 2017 Wiley-VCH.

