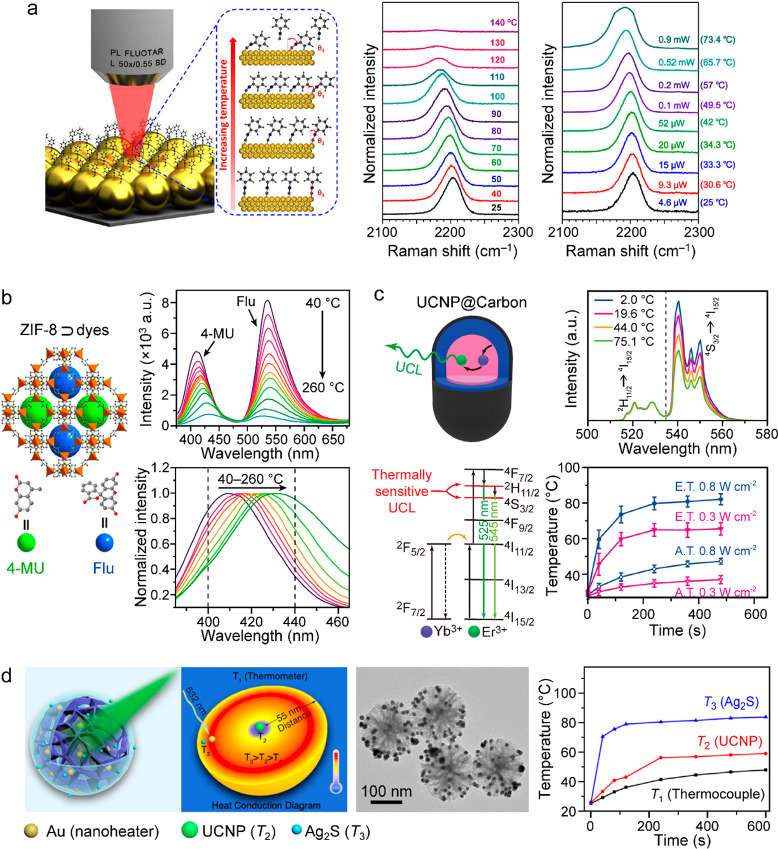
Figure 14.
Heater–thermometer nanoplatforms. (a) Schematic (left) showing the temperature-dependent orientation change of phenyl isocyanide molecules on the surface of Au nanoparticles, and resultant temperature- (middle) and laser power-dependent (right) surface-enhanced Raman scattering (SERS) spectra of the N≡C stretching vibrations. Reprinted with permission from ref (411). Copyright 2018 American Chemical Society. (b) Dye-loaded ZIF-8 for temperature sensing based on the luminescent intensity ratio and emission peak shift. Reprinted with permission from ref (414). Copyright 2021 American Chemical Society. (c) Core@shell NaLuF4:Yb,Er@NaLuF4 UCNPs coated by carbon for photothermal heating and temperature sensing. Upper left: schematic of the UCNP@C nanoparticles. Lower left: energy diagram of the thermally sensitive UCL process. Upper right: emission spectra of the UCNP@C nanoparticles at different temperatures by external heating. Lower right: temperature evolution of the UCNP@C nanoparticles in an aqueous dispersion under irradiation with a 730 nm laser at 0.8 and 0.3 W·cm–2. A.T.: apparent temperature recorded by a thermal camera. E.T.: eigen temperature calculated by the UCL spectra. Reprinted from ref (396). Copyright 2015 Springer Nature under the CC BY 4.0 license http://creativecommons.org/licenses/by/4.0/. (d) Multilayer NaYbF4:2%Er@NaYF4@mSiO2@Au@SiO2@Ag2S nanoparticles. From left to right: schematic illustrating the multilayer structure, heat conduction diagram under internal heating, TEM image of the multilayer nanoparticles, and temperature evolution (T1: apparent temperature of the solution measured by a thermocouple; T2: core temperature measured by the UCNPs; T3: outmost layer temperature measured by the Ag2S QDs). Reprinted with permission from ref (415). Copyright 2020 American Chemical Society.

