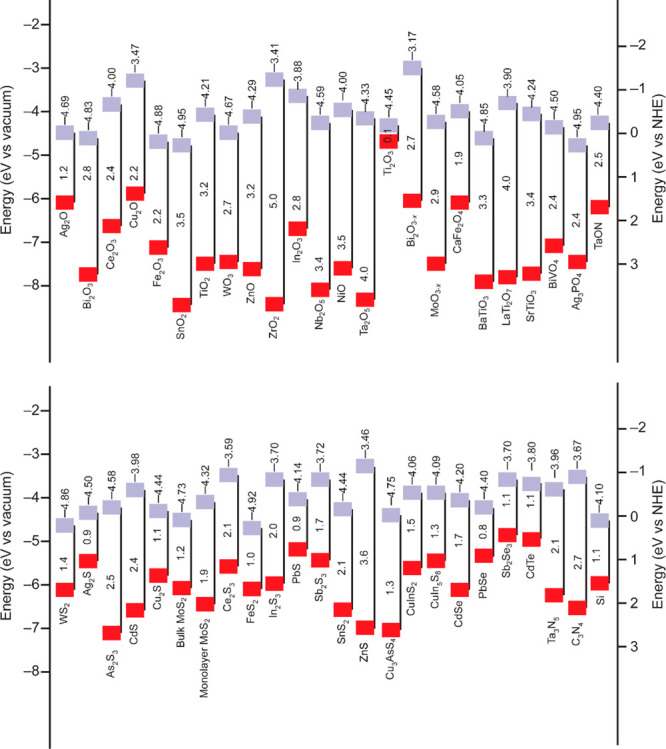
Figure 5.

Band edge positions and bandgaps with respect to the vacuum level and the normal hydrogen electrode (NHE) for selected semiconductors including oxides, chalcogenides, nitrides, and silicon. The top squares indicate the conduction band edges. The bottom squares indicate the valence band edges. The top numbers represent the exact conduction band levels, and the numbers between the squares show the bandgaps. The data are taken from ref (272) with permission from the Royal Society of Chemistry and modified according to the new works.273,274
