
FIGURE 1.
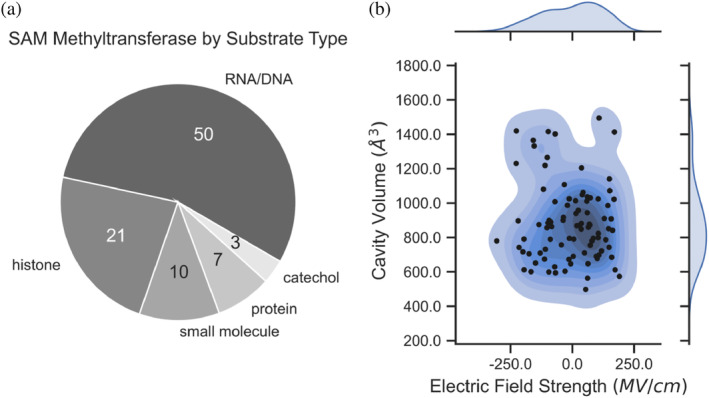
A survey of the compiled SAM MTase data set. The pie chart (a) on the left shows the functional breakdown of the MTases. Classifications are based on the EC number when available and are derived from the original publication if no EC number was supplied. The contour plot (b) on the right shows the distributions of cavity volume and electric field for all 91 MTases. The center of (b) shows a topographical view of the values in two dimensions and the margins show one‐dimensional kernel density estimation plots of each respective dimension.