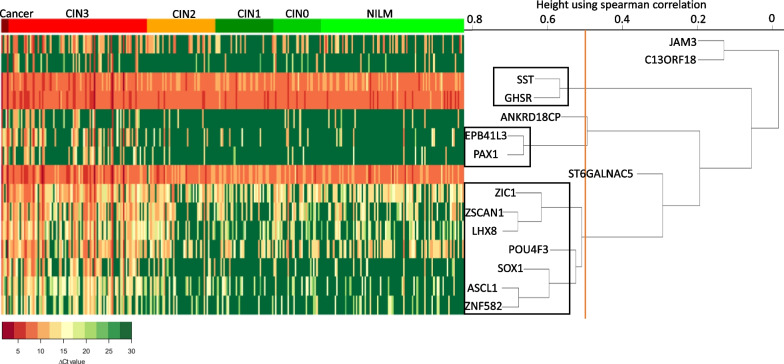
Fig. 3.
Hierarchical clustering of the methylation markers. The rows represent the different methylation markers, and the columns the individual hrHPV-positive self-samples. The self-samples are ranked based on histological outcome (legend on top). The colours in the histogram demonstrate the ∆Ct values, green represents a high ∆Ct (low methylation level) and red a low ∆Ct (high methylation level). The cut-off of the Spearman correlation to identify markers present in the same cluster was set at 0.5 (indicated by the orange line). The black boxes represent the different clusters

