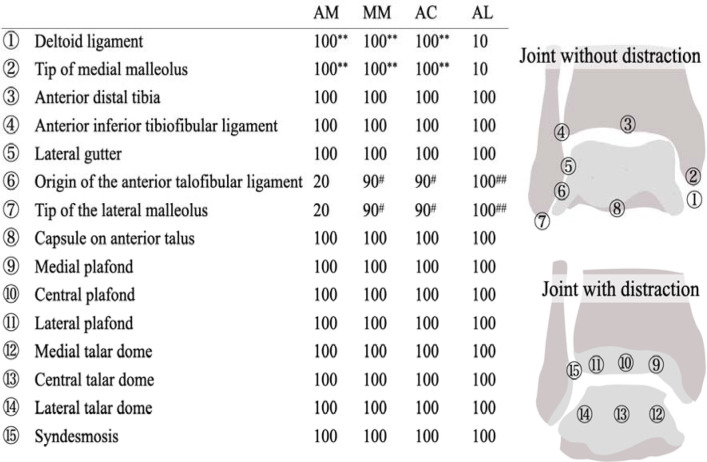
Table 1.
Percentage of the 15 Points That Could Be Visualized From Each Portal a

|
a Data are reported as percentage of all ankles. AC, anterocentral; AM, anteromedial; AL, anterolateral; MM, medial midline.
b Significant differences compared with AL (P < .01)
c Significant differences compared with AM (P < .05).
d Significant differences compared with AM using post hoc pairwise comparisons (P < .01).
