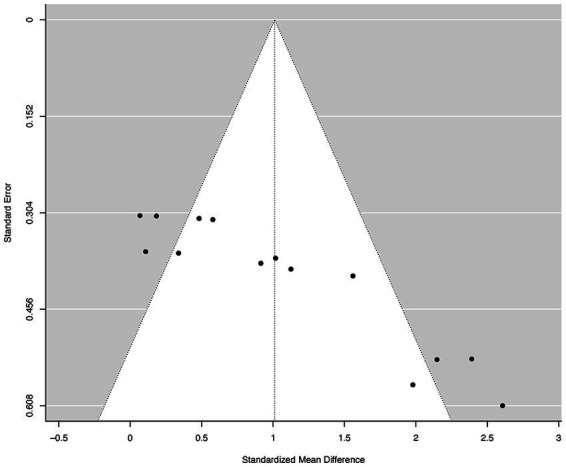
Figure 2.

Funnel plots of the standard differences in means vs. standard errors. The aggregated standard difference in means is the random effects mean effect size weighted by the degrees of freedom study characteristics.

Funnel plots of the standard differences in means vs. standard errors. The aggregated standard difference in means is the random effects mean effect size weighted by the degrees of freedom study characteristics.