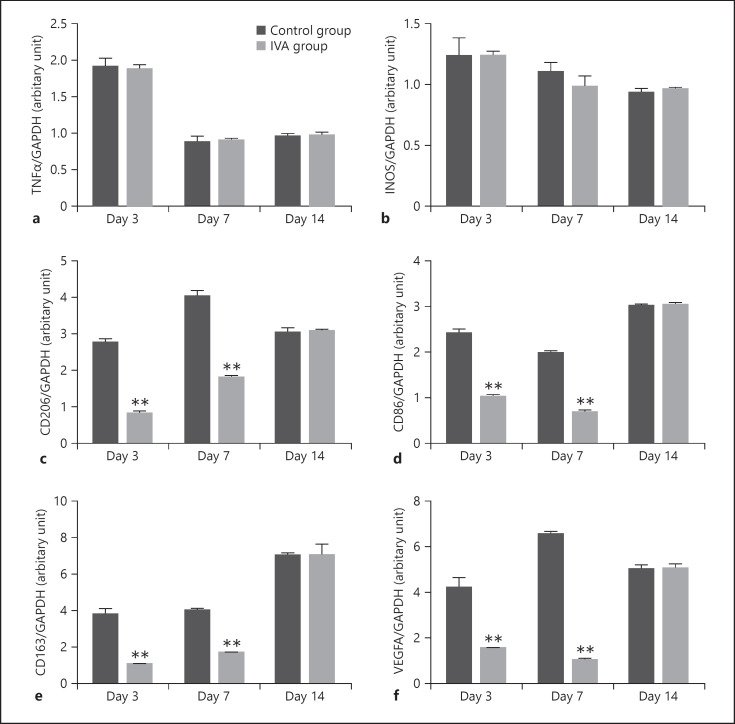
Fig. 4.
RT-PCR analysis of gene expression of TNF-α, iNOS, CD206, CD86, CD163, and VEGFA in the RPE-choroid-sclera complex of laser-induced CNV mice groups and aflibercept treatment groups at different time points. The level of TNF-α (a) and iNOS (b) was not significantly different between the 2 groups. The level of CD206 (c), CD86 (d), CD163 (e), and VEGFA (f) significantly decreased on days 3 and 7 in the aflibercept treatment group. Data are presented as mean ± SEM, n = 6 for each time point. *p < 0.05, **p < 0.001.

