Figure 3.
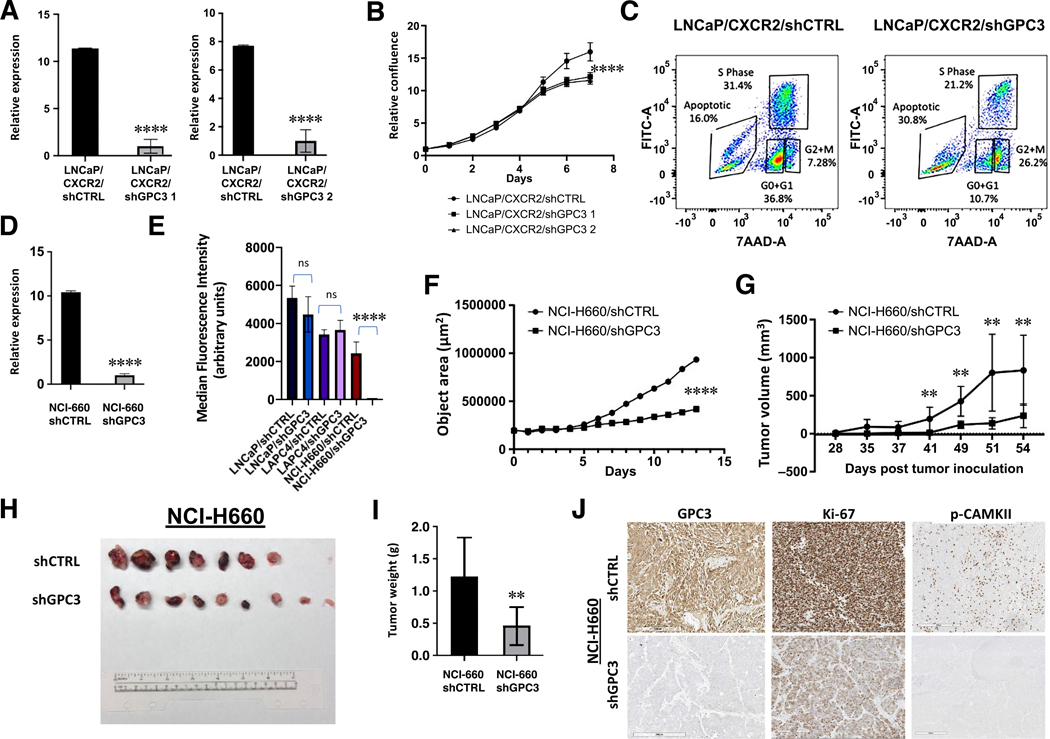
GPC3 is critical to the viability of NE cells and SCNC. (A) RT-qPCR demonstrating GPC3 knockdown in LNCaP/CXCR2. (B) Growth curve comparing LNCaP/CXCR2/shCTRL versus LNCaP/CXCR2 /shGPC3. (C) BrdU Incorporation of LNCaP/CXCR2/shCTRL versus LNCaP/CXCR2/shGPC3. (D) RT-qPCR demonstrating GPC3 knockdown in NCI-H660 cells. (E) Quantification of MFI values from Calcein AM viability assay comparing LNCaP/shCTRL versus LNCaP/shGPC3, LAPC4/shCTRL versus LAPC4/shGPC3, and NCI-H660/shCTRL versus NCI-H660/shGPC3. (F) 3D aggregate growth curve comparing NCI-H660/shCTRL versus NCI-H660/shGPC3. (G) Tumor growth rate of NCI-H660/shCTRL and NCI-H660/shGPC3 xenografts. (H) Images of resected xenograft tissue from mice inoculated with NCI-H660/shCTRL versus NCI-H660/shGPC3 cells. (I) Final tumor weights of resected NCI-H660 xenograft tissue. (J) Representative image demonstrating GPC3, Ki-67, and p-CAMKII expression in resected xenograft tissue (scale bar, 200 μm). Statistics: t-test with p < 0.05 considered significant. p < 0.01 (**), p < 0.00001 (****).

