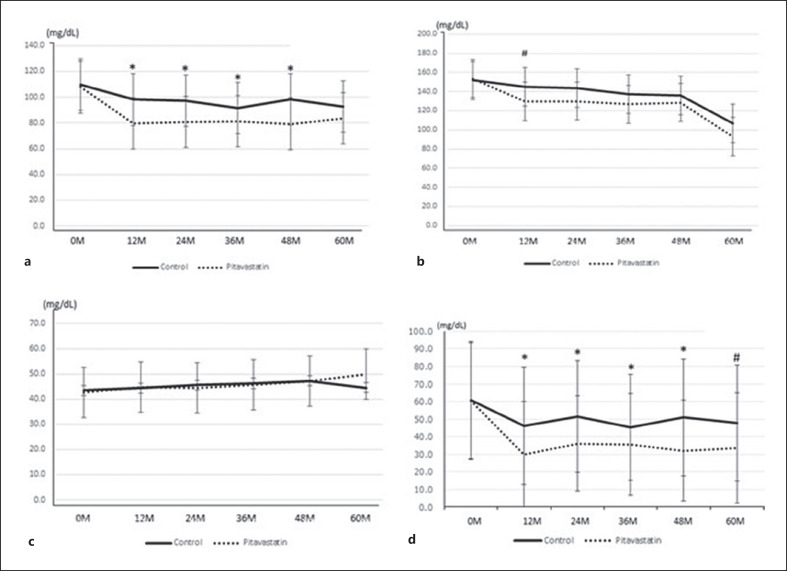
Fig. 2.
Changes in serum lipids were confirmed in each group after 12, 24, 36, 48, and 60 months and compared between the two groups at the time points. LDL-C in the pitavastatin group was significantly lower than that in the control group from 12 to 48 months. The levels of LDL-C in the pitavastatin group were significantly lower than those in the control group at 12, 24, 36, 48, and 60 months (*p < 0.001) (a). TG levels in the pitavastatin group were also lower during the observation period, but a significant difference was observed only at 12 months (#p < 0.05) (b). The level of HDL-C was no change in both the two groups during the observation period, and there was no significant difference between the two groups (c). The serial changes of non-HDL-C in both groups tended to be similar to those of LDL-C. The levels of LDL-C in the pitavastatin group were significantly lower than those in the control group at 12, 24, 36, 48, and 60 months (*p < 0.001, #p < 0.05) (d).

