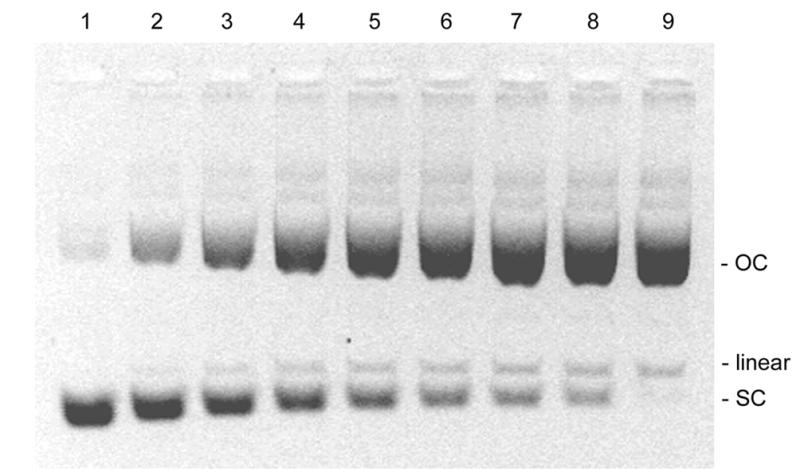
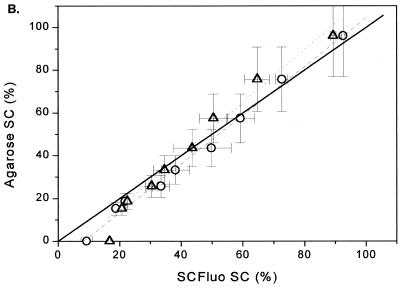
Figure 5.

(A) Agarose gel electrophoresis of pSVβ preparations containing decreasing amounts of SC DNA and increasing amounts of OC and linear DNA prepared by serial dilution of P-DNA into O-DNA. Lanes 1–9, mixtures of P-DNA:O-DNA in the ratios 1:0, 0.75:0.25, 0.56:0.44, 0.42:0.58, 0.32:0.68, 0.24:0.76, 0.18:0.82, 0.13:0.87 and 0:1, respectively. (B) Correlation analysis between the SC% obtained from densitometric scanning of the agarose gel and the SC% obtained from substituting values from the SCFluo method into equations 8 (circles) and 9 (triangles). Solid line, theoretical ideal correlation; dashed line, linear regression (y = 0.87x + 8.33, r2 = 0.99) obtained by substituting all values (n = 9) in equation 8; dotted line, linear regression (y = 0.81x + 7.42, r2 = 0.99) obtained by substituting in equation 9 values for samples with >20% SC (n = 7). Values shown depict means of at least two determinations; x error bars, standard deviation; y error bars, coefficient of variation of 20% associated with the agarose gel electrophoresis technique.

