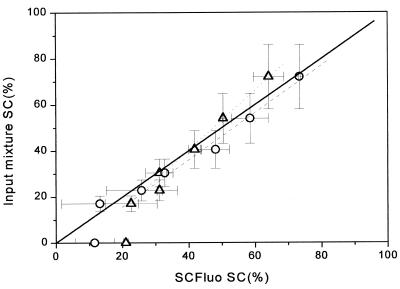
Figure 7.
Correlation analysis between the SC% of the input mixture and the SC% obtained from substituting values from the SCFluo method into equations 8 (circles) and 9 (triangles). Solid line, theoretical ideal correlation; dashed line, linear regression (y = 0.97x + 3.5, r2 = 0.99) obtained by substituting all values (n = 7) in equation 8; dotted line, linear regression (y = 0.77x + 8.96, r2 = 0.99) obtained by substituting in equation 9 values for samples with >30% SC (n = 4). Values shown depict means of at least two determinations; x error bars, standard deviation; y error bars, coefficient of variation of 20% associated with the agarose gel electrophoresis technique.

