
Figure 4.
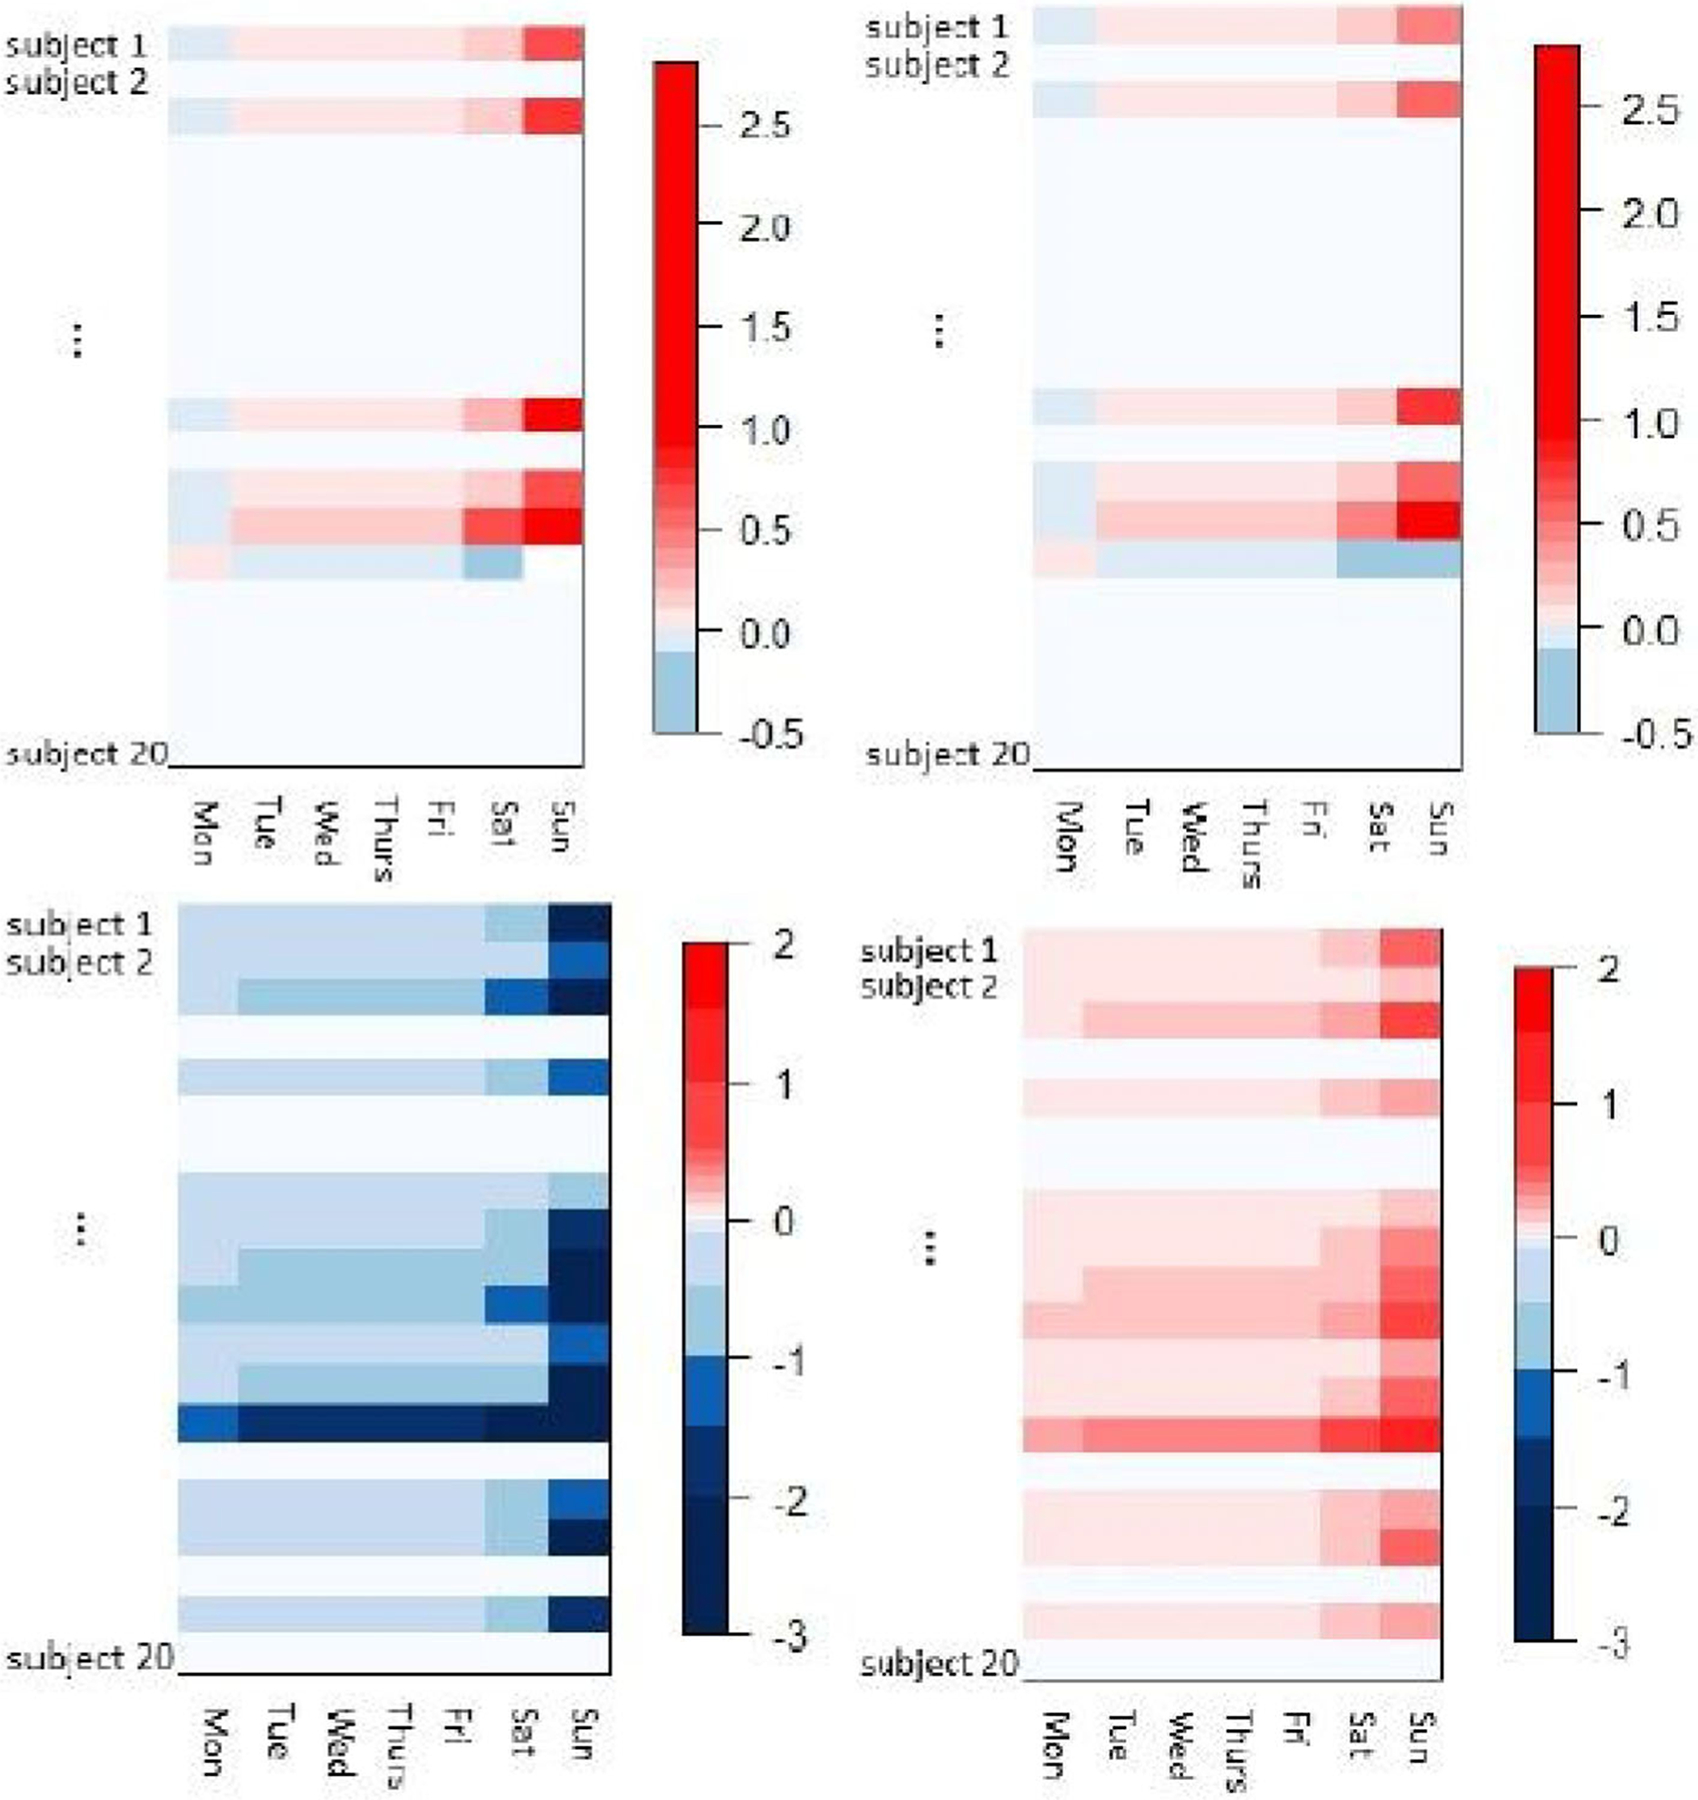
Digital advertising application example. Shown are the estimated coefficient tensor. In each panel, the rows represent users and columns represent days of a week. The top panels are for the topic “online dating,” and the bottom panels for “investment.” The left panels are slices from the topic mode, and the right panels are slices from the impression mode.