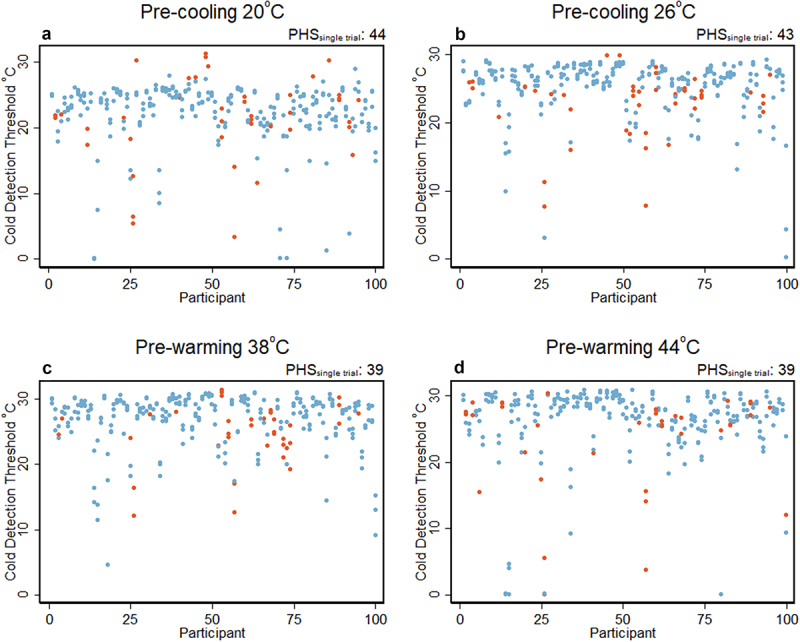
Figure 2.

Trial-level results. The figure depicts single trial threshold values in °C associated with PHS (Orange) and normal values (blue) for each participant separately. Trials in which the response time was less than 250 ms and trials with no button press were excluded from the analysis (details in supplementary Table S1). The subtitle “PHSsingle trial” on top of each graph depicts the number of PHS in total for all trials. a: pre-cooling of 20°C. b: pre-cooling of 26°C. c: pre-warming of 38°C. d: pre-warming of 44°C. Blue: thresholds (°C) rated as cold, and Orange: thresholds (°C) rated as PHS.
