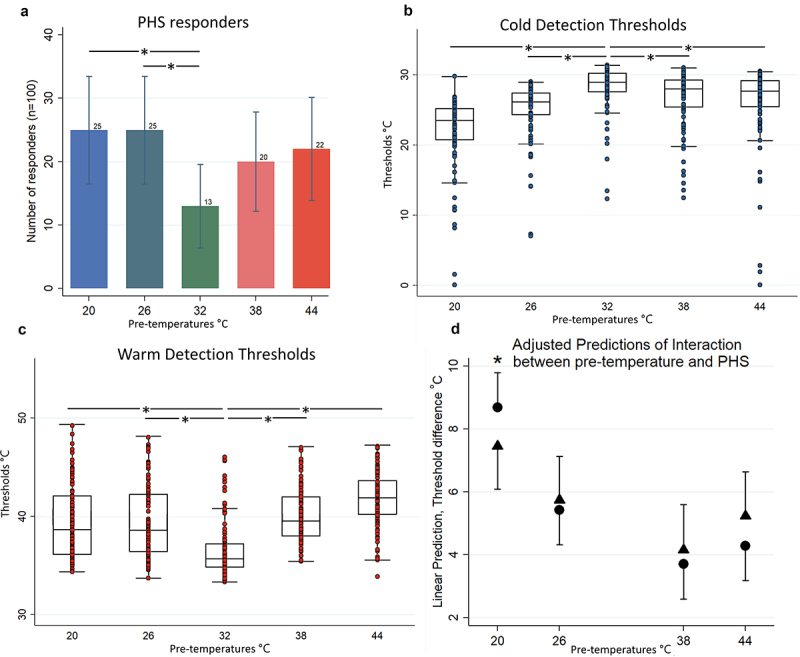
Figure 3.

Results. a: Bar chart with the number of participants with at least one PHS during the different preceding temperatures in the mTSL protocol. For the control sequence (32°C) the temperature was alternating while for temperatures with pre-warming or pre-cooling the temperature change was always in one direction. The number of PHS was larger during pre-temperatures of 20°C and 26°C than during baseline mTSL32°C. * p < 0.025 (McNemar’s exact test), number on top of bars: number of PHS responders, and whiskers: 95% CI. b and c: Boxplot of cold (b) and warm (c) detection thresholds from the mTSL, after different fixed temperatures. Higher cold and warm detection thresholds for all fixed temperatures than CDT and WDT from the QST. * p < 0.001 (Wilcoxon signed-rank test), CDT: cold detection threshold, dots: individual values, hinge: inter quartile range, horizontal line: median, WDT: warm detection threshold, and whiskers: adjacent values. d: Adjusted predictions of the temperature values (difference from baseline, °C) illustrating the interaction between pre-temperatures and PHS. The predicted variable was the temperature values (°C) at which participants detected a temperature change in the cold range. The fixed effects were gender (female), age (44, median of population), trial [1], and sequence [1]. The random effect was participant ID. The CI intervals should be interpreted carefully since data is paired. The circled markers represent the predicted mean of the temperature difference (°C) associated with the detection of temperature changes perceived as cold (i.e. normal sensation). Instead, the triangular markers represent the predicted mean of the temperature difference (°C) associated with the detection of temperature changes perceived as warm (i.e. PHS). The whiskers depict the upper or lower CI – for clarity only the upper or lower CIs are presented. * p = 0.013 (joint test of all the coefficients associated with the interaction of pre-temperature and PHS are equal to 0).
