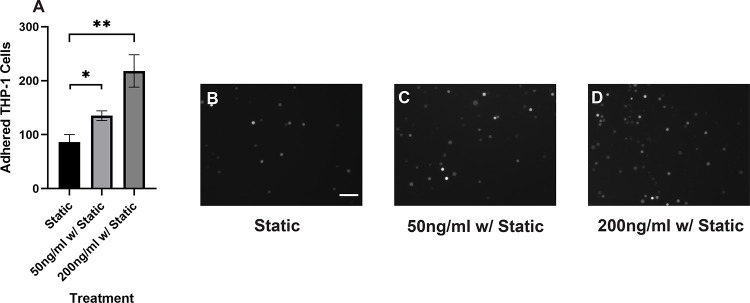
Figure 6.
A) Quantitative analysis of statically incubated THP-1 cells adhering to B) untreated HNDMVECs, C) HNDMVECs pretreated with 50 ng/mL IL-8 for 1 hour, and D) HNDMVECs pretreated with 200 ng/mL IL-8 for 1 hour. Additional images see Figure S5. Scale bar = 100 μm. Statistical significance is denoted by ‘*’. P values less than 0.05 are indicated by single symbol and P values less than 0.01 are indicated by double symbols.

