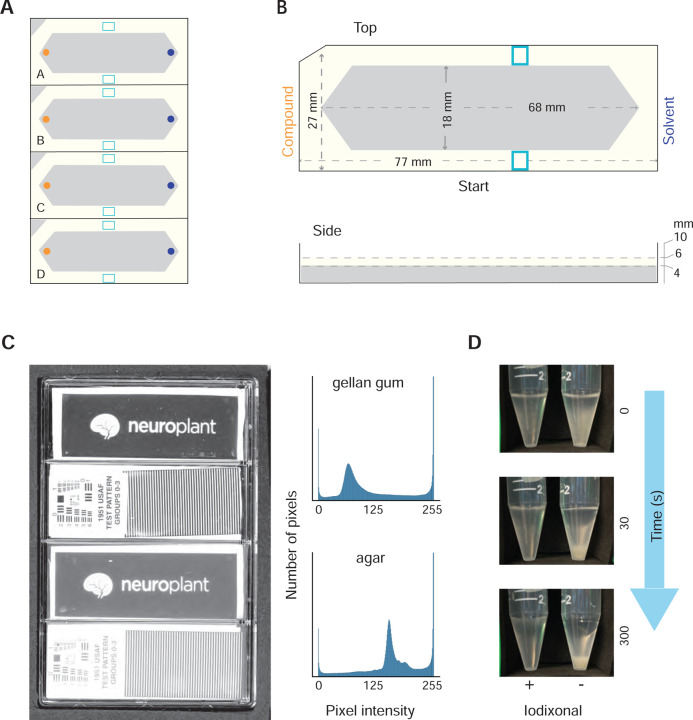
Fig 1. Measures that enable increased throughput of population-based C. elegans chemotaxis assays.
(A) Schematic of a 4-lane assay plate (standard microtiter plate footprint) showing foam inserts. (B) Top and side view dimensions of a single foam insert. Panels A and B illustrate the assay starting zone (light blue), position of the test compound (side with notched corner, orange), and the reference or solvent (opposite, dark blue). (C) Image collected on a flatbed scanner of a single 4-well assay plate (left) containing Gelrite™ gellan gum (top two lanes) and agar (bottom two lanes). Transparent test patterns (Neuroplant logo, 1951 USAF test pattern) placed on the surface of the solid media are used to illustrate improved clarity for gellan gum compared to agar. Intensity histogram drawn from the image of the test pattern imaged through gellan gum (top) and agar (bottom). (D) Still images of a time lapse observation of worms suspended in chemotaxis buffer with (+, left) and without (−, right) Optiprep™ solution of iodixonal (7:3 chemotaxis buffer: Optiprep™).

