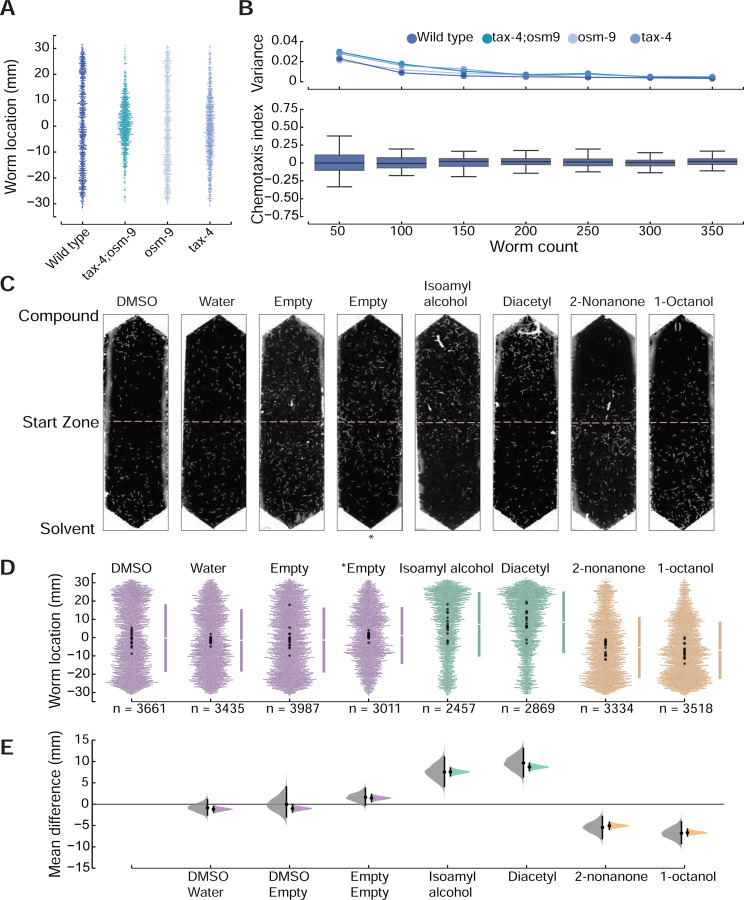
Fig 2. Optimization and validation of chemotaxis performance and derivation of average position as a robust chemotaxis metric.
(A) Distribution of animals following exposure to symmetric DMSO. Each dot represents the y coordinate of a single animal of the indicated genotype, pooled across three biological replicates: wild-type (N2), tax-4(p678);osm-9(ky10), osm-9(ky10), and tax-4(p678). (B) Average (± s.d.) chemotaxis index for wild-type animals (bottom) and variance for the indicated genotypes (top) as a function of the number worms in an assay arena. The data are a bootstrap analysis of the data in panel A for sample sizes from 50 to 350 (increments of 50) animals. (C) Representative images of assay arenas following exposure to (left to right): four null conditions, two known attractants, and two known repellents. DMSO is on the solvent (bottom) side, except for the empty condition denoted by an asterisk,*. (D) Swarm plots pooled across 16 technical replicates for each condition shown in panel C. Bars to the right of each swarm show the ± one standard deviation, with the gap between the bars indicating the mean worm position. Points are color-coded according to condition: null reference or control conditions (purple), attractants (green), repellents (gold). Larger points (black) are the mean worm location for individual replicates. (E) Effect size relative to the DMSO:DMSO null condition. Black bars and shaded areas show the difference of the mean values and the 95% confidence intervals for this value, bootstrapped from the data for each test condition. Leftward facing shaded areas (gray) represent the results considering each assay and rightward facing areas (colors) represent the results obtained by pooling across replicates. Mean differences [±95% CI] of the 16 assays are: DMSO:H2O, −0.84 [−2.67, 1.27]; DMSO:Empty, −0.06 [−2.99, 4.09]; Empty:Empty, 1.62 [−0.22, 3.69]; isoamyl alcohol, 7.50 [4.16, 11.00]; diacetyl, 9.65 [6.38, 13.05]; 2-nonanone, −5.45 [−8.05,−2.90]; 1-octanol, −6.80 [−9.24, −4.10]. Mean differences [±95% CI] of the pooled data are: DMSO:H2O, −1.20 [−2.00, −0.40]; DMSO:Empty, −1.03 [−1.79, −0.27]; Empty:Empty, 1.43 [0.66, 2.21]; isoamyl alcohol, 7.55 [6.65, 8.45]; diacetyl, 8.70 [7.90, 9.55]; 2-nonanone, −5.07 [−5.89, −4.28]; 1-octanol, −6.66 [−7.40, −5.88]. Instances that exclude a mean difference of zero are considered bona fide responses compared to the null condition. Positive values indicate attraction (positive chemotaxis) and negative values indicate repulsion (negative chemotaxis).

