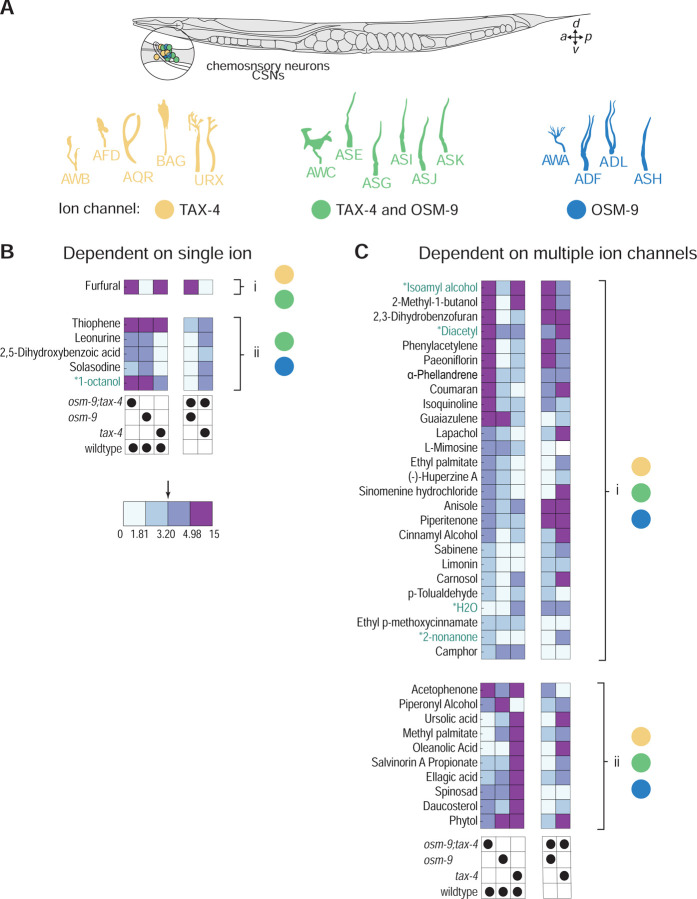
Fig 7: Graphical summary of behavioral responses to chemoactive compounds and proposed links to candidate chemosensory neurons (CSNs).
(A) Schematic showing the position of C. elegans anterior chemosensory neurons (CSNs) on the right side of an adult animal (top). With the exception of AQR, CSNs are bilaterally symmetric. CSNs have distinctive cilia, shown schematically (bottom). Color indicates expression of chemosensory transduction ion channels in each CSN, where yellow, blue, and green, highlight CSNs expressing tax-4, osm-9, or both ion channel genes, respectively. (B) SM responses primarily dependent on tax-4 (i) and osm-9 (ii) based on how responses are modified by mutations. Each column in the heatmap represents the |ΔΔ| values for the pairs of genotypes indicated below. (C) SM responses dependent on both tax-4 and osm-9 (i) or that invert valence in single mutants (ii). The color bar delineates the range of effect sizes binned into quartiles and numbers indicate values separating quartiles. The arrow denotes the median of the effect sizes where values to the right (> median) have a larger effect and values to the left (< median) indicate little to no effect.

