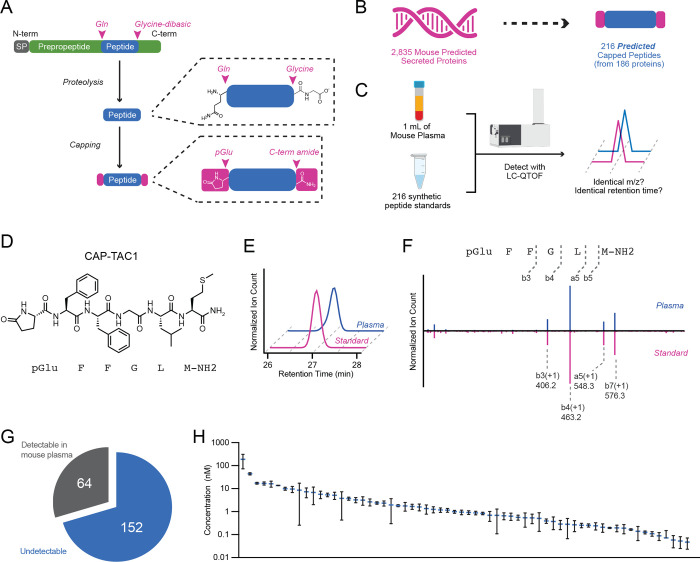
Fig. 1. Genomic prediction and mass spectrometry detection of capped peptides in mouse plasma.
(A) Schematic representation of capped peptide production from secreted, full-length preproprecursor proteins. N-term, N-terminal; C-term, C-terminal; SP, signal peptide; Gln, glutamine; pGlu, pyroglutamyl. (B,C) Number of predicted mouse capped peptides (B) and the targeted mass spectrometry strategy for their detection (C). (D) Chemical structure of CAP-TAC1 (pGlu-FFGLM-NH2). (E,F) Representative extracted ion chromatogram at m/z = 724.3 (E) and mirror fragmentation spectra (F) of authentic CAP-TAC1 standard (pink) and the endogenous mouse plasma peak (blue). (G, H) Pie chart showing number of detectable capped peptides in mouse plasma (G) and their quantitation (H). For (H), data are shown as means ± SEM (N=3 mice).

