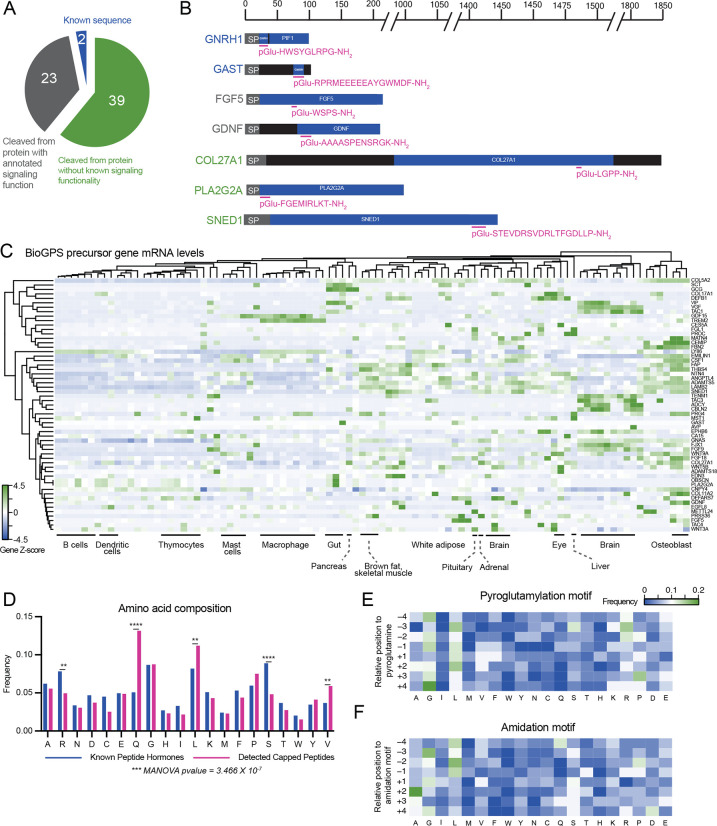
Fig. 2. Sequence and gene-level analysis of capped peptides.
(A,B) Pie chart (A) and representative examples (B) of the distribution of mouse capped peptides based on their full-length preproprotein precursors. SP, signal peptide. (C) H-clustered heat map of mRNA expression for capped peptide preproprecursor home genes across mouse tissues and cell types. (D) Frequency of each amino acid in capped peptides versus a Uniprot reference set of known peptide hormones and neuropeptides. (E, F) Heat map of amino acid frequency within four residues upstream and downstream of the N-terminal pyroglutamylation (E) or C-terminal amidation (F). For (C), data were obtained from BioGPS and shown as Z-score of the log-transformed value.

