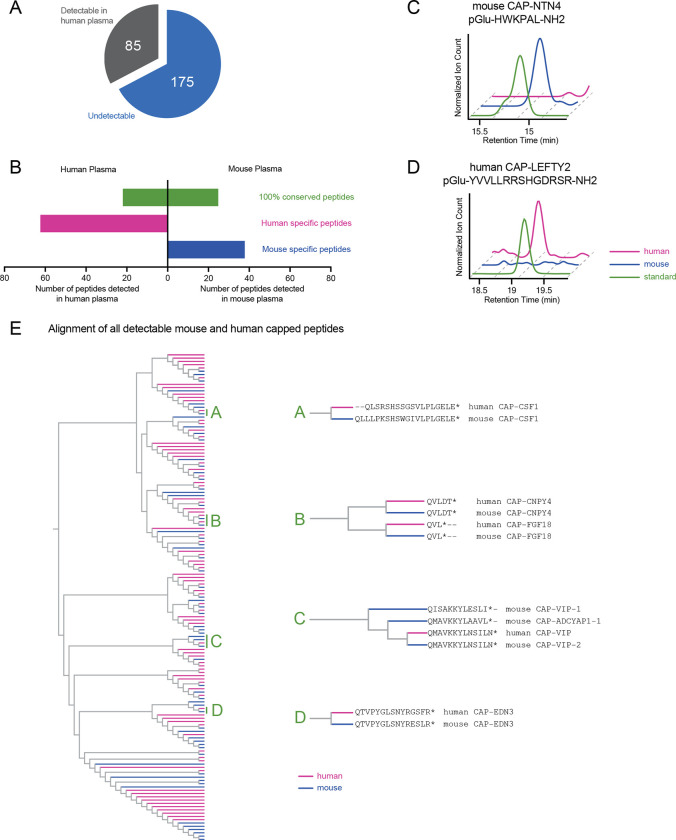
Fig. 6. Detection of human capped peptides and sequence alignment comparison to mouse.
(A) Pie graph of detectable human capped peptides. (B) Number of human or mouse capped peptides detected in human or mouse plasma, stratified by those capped peptide with 100% conservation (green) or those that are not 100% conserved (human-specific, purple; mouse-specific, blue). (C,D) Representative extracted ion chromatograms of the indicated capped peptides in plasma from the indicated species. (E) Phylogenetic alignment of all detectable capped peptides in human and mouse, with primary capped peptide sequences for select subclusters A-D shown on the right.

