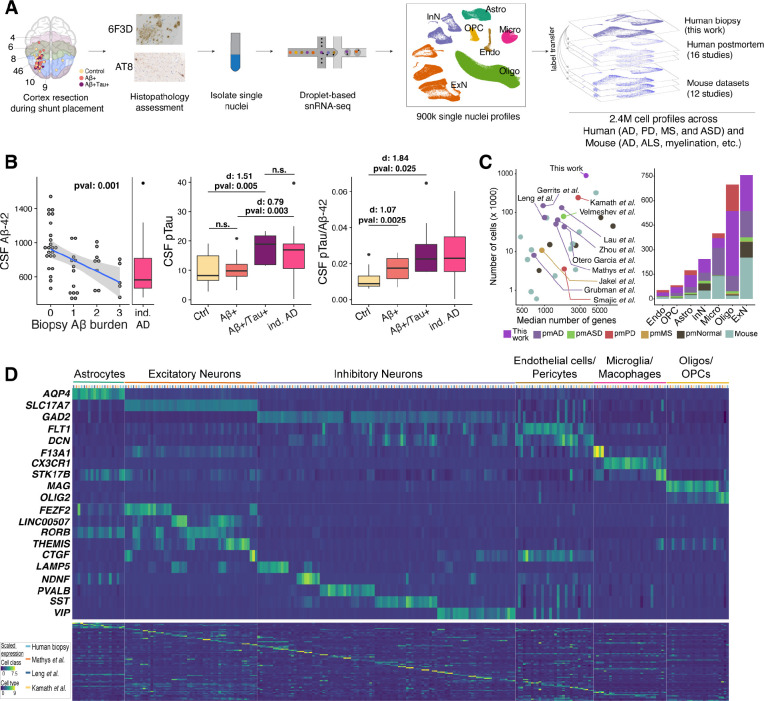
Figure 1. A fresh-tissue atlas of cortical states associated with AD pathology.
A) Schematic of the frontal cortex brain biopsy sampling workflow. Samples were stained and quantitatively assessed for AD histopathology by the 6F3D and AT8 (phosphorylated tau) antibodies (Methods). Brodmann areas are color-coded in the first panel. B) CSF (left), phosphorylated tau (middle) and ratio of the two (right) in association with and tau burden scores (see Methods) in 49 subjects sampled. We have excluded three individuals for whom the CSF measurements were missing. The “ind. AD” refers to an independent cohort of 36 NPH patients who were clinically diagnosed with AD prior to, or within one year after, CSF collection. Cohen d (d) effect sizes are reported. C) A summary of datasets included in the integrative analysis. Case-control datasets of human brain diseases are labeled. pm, postmortem; ASD, autism spectrum disorder; PD, Parkinson’s disease; MS, multiple sclerosis. D) Expression of markers of cell classes (top), main neuronal classes (middle), and individual cell types (bottom) across four human studies of neurodegenerative disease from the integrative analysis. Each row indicates the normalized expression level of each gene across the select human postmortem datasets (color-coded on y-axis) and 82 cell types. A detailed analysis of cell types and associated markers can be found in Table S3.

