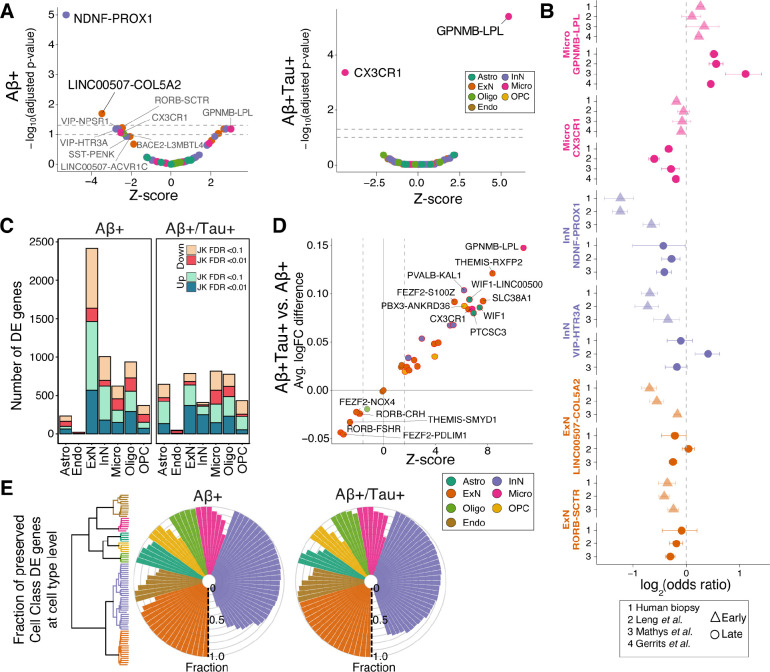
Figure 2. Identification of early- and late-stage cellular perturbations in AD.
A) Volcano plot of a meta-analysis of cell type proportional changes (Methods) in early- and late-stage AD-related samples. Cell types reaching significance are labeled. Colors indicate cell class assignment. Dashed lines represent FDR thresholds of 0.05 and 0.1. B) Individual log-odds ratios of six significant cell types in (triangles) and samples (circles) for our biopsy cohort and published postmortem AD case-control datasets. Whiskers indicate standard errors. C) Number of DE genes in each cell class, stratified by biopsy histopathology. JK: Jack-knife. D) Fold change pattern concordance of DE genes between and samples. The y-axis shows the average logFC difference between and . The Z-scores on x-axis are based on the transformation of p-values from a paired t-test analysis on the union of top 300 protein-coding genes (sorted by their jack-knifed p-value) from each condition. E) Fraction of DE genes in and biopsies that are similarly up- or down-regulated between the seven major cell classes and their associated subtypes in biopsy samples. The fraction was calculated by examining the top 300 protein-coding DE genes at the cell class. The dendrogram illustrates the subdivision of the seven major cell classes to a total of 82 subtypes.

