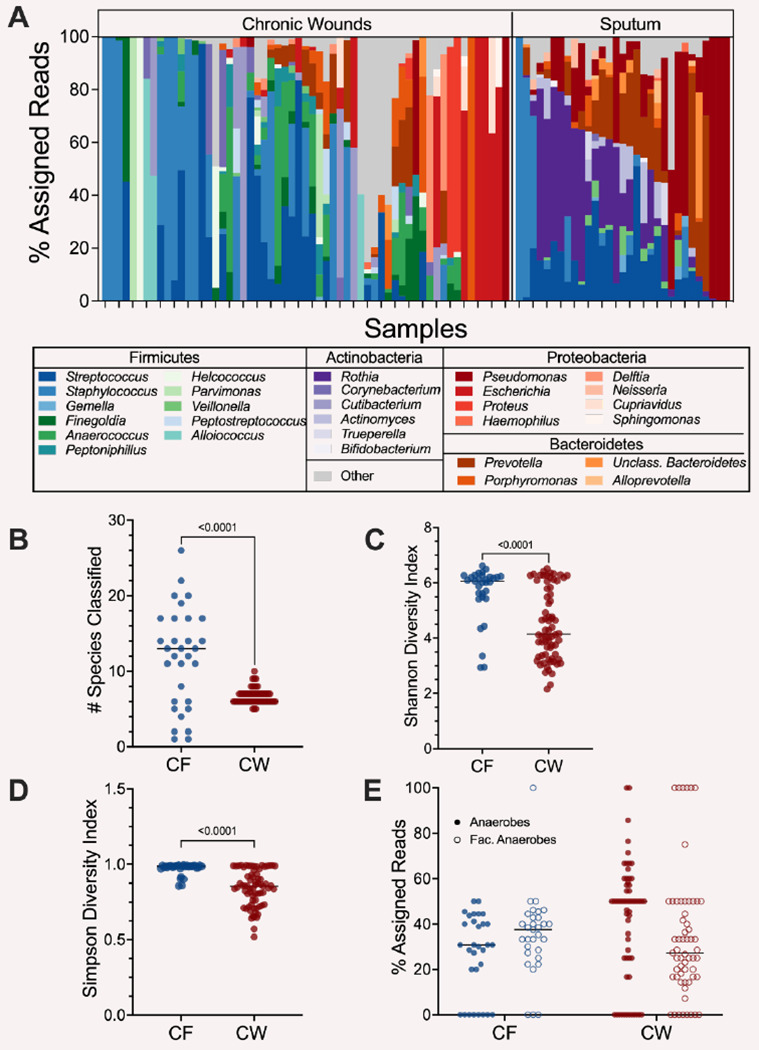
Figure 1: Bacterial community composition in CF and CW environments.

A) Relative abundance of bacterial genera present in at least 3 samples with a % assigned read abundance of at least 1%. 29 genera were identified in CF samples and CW 36 in wound samples. B) Distribution of the number of species with a relative abundance of at least 1% in CF and CW samples. C) The Shannon diversity index of each sample. D) Distribution of the Simpson diversity index in each sample. E) Distribution of the percentage of reads assigned to anaerobes (closed circles) and facultative anaerobes (open circles) in each sample in the CF and CW environments. For plots B-E, CF samples are in blue and CW samples are in red. P-values and brackets indicate comparisons that were deemed statistically significant (T-test, P-value <0.05)
