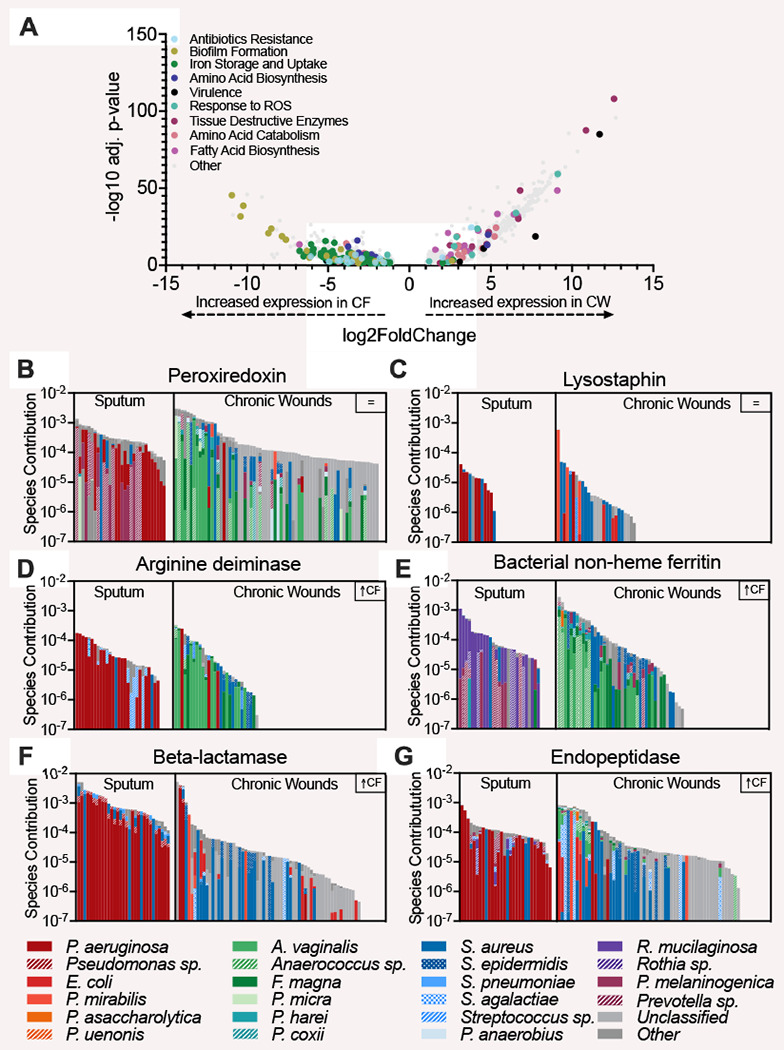
Figure 2: Distinct expression of microbial functions in CF and CW communities.

A) Volcano plot to highlight differentially expressed functions between infection sites as identified by SAMSA2. 40.37% of the functions were differentially expressed (adjusted P-value <0.05, log2FoldChange > 1. B & C) Bacterial contribution to the expression of functions conserved across CF and CW environments. D-G) Bacterial contribution to the expression of differentially expressed functions.
