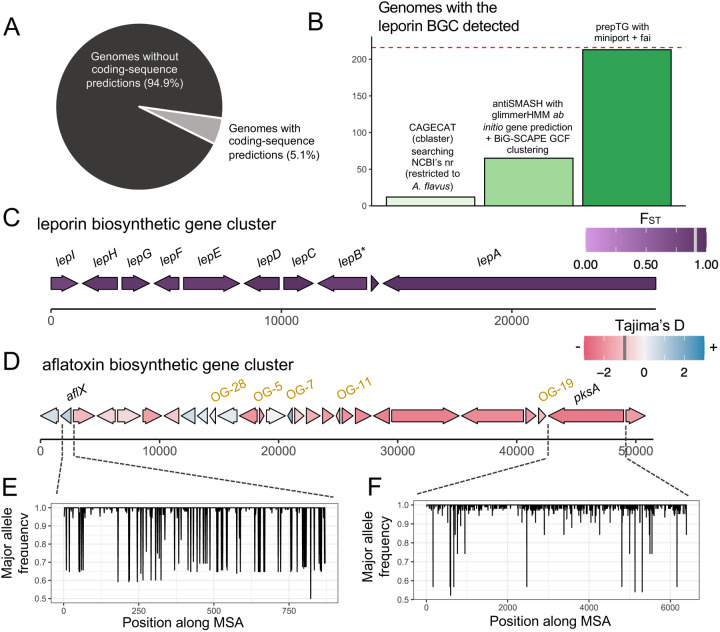
Figure 3: Evolutionary trends of common BGCs in A. flavus.
A) The proportion of 216 A. flavus genomes from NCBI’s GenBank database with coding-sequence predictions available. B) Comparison of the sensitivity of fai and alternate approaches based on assemblies for detecting the leporin BGC. The red-line indicates the total number of genomes (n=216) assessed. A schematic of the (C) leporin and (D) aflatoxin BGCs is shown with genes present in ≥ 10% of samples shown in consensus order and relative directionality. Coloring of genes in (C) corresponds to FST values and in (D) to Tajima’s D values, as calculated by zol. Grey bars in the legends, at (C) 0.92 and (D) −0.98, indicate the mean values for the statistics across genes in the BGC. *For the leporin BGC, lepB corresponds to an updated open-reading frame (ORF) prediction by Skerker et al. 2021 which was the combination of AFLA_066860 and AFLA_066870 ORFs in the MIBiG entry BGC0001445 used as the query for fai. For the aflatoxin BGC, ORFs which were not represented in the MIBiG entry BGC0000008 but predicted to be within the aflatoxin BGC by mapping of gene-calls from A. flavus NRRL 3357 by Skerker et al. 2021 are shown in gold. The major allele frequency distributions are shown for (E) aflX and (F) pksA, which depict opposite trends in sequence conservation according to their respective Tajima’s D calculations.

