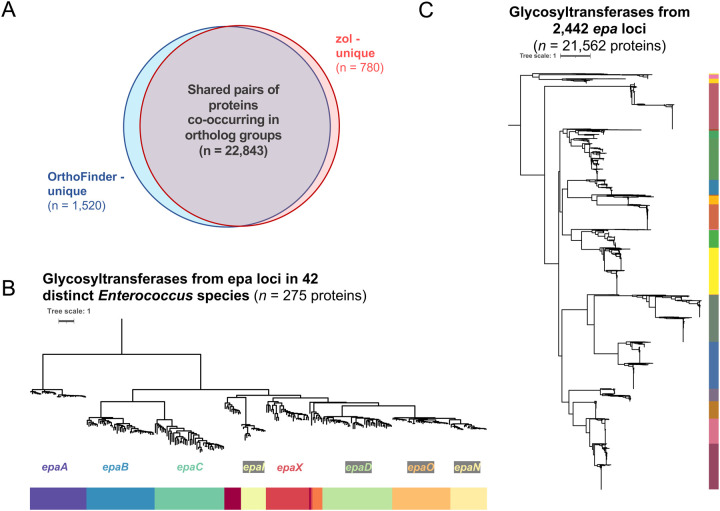
Figure 5: Assessment of gene-cluster restricted ortholog grouping by fai and zol.
A) zol gene-cluster constricted ortholog group predictions for epa locus proteins from 42 distinct representative enterococcal species were compared to genome-wide predictions of ortholog groups by OrthoFinder. A phylogeny based on gap-filtered protein alignments of ortholog groups with domains featuring “glycosyl” and “transferase” as key words is shown from (B) epa loci in the 42 representative genomes and (C) a more comprehensive set of 2,442 epa loci. Each node represents a specific protein and coloring of the track corresponds to their ortholog group designations by zol. Note, (B) 2 (0.07%) and (C) 79 proteins (0.4%) were removed prior to phylogeny construction due to an abundance of gaps in the trimmed alignment.

