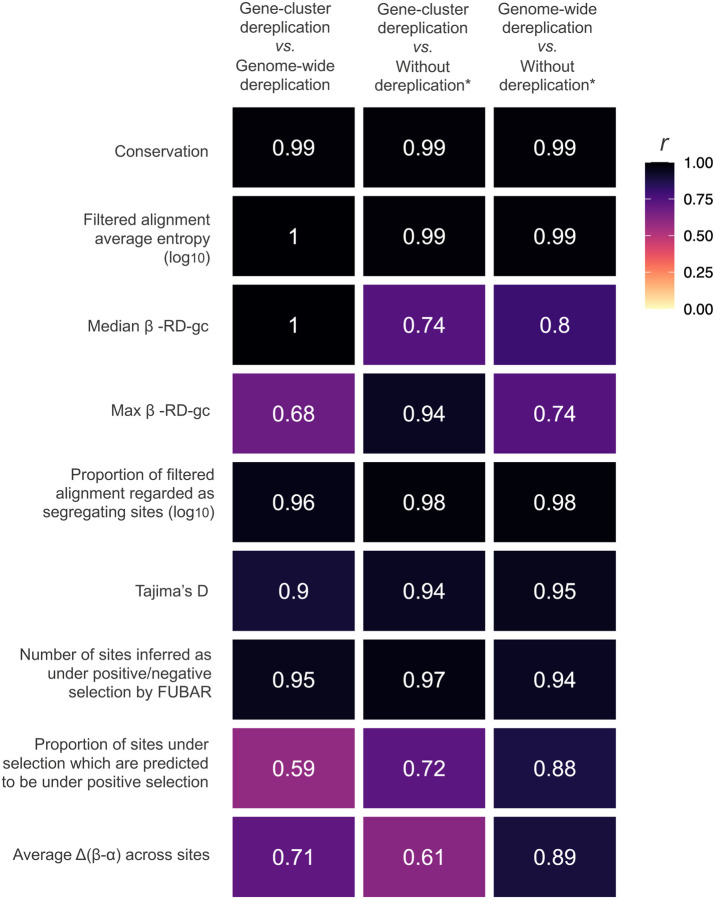
Figure 6: Effects of dereplication on the calculation of evolutionary statistics by zol.
The heatmap shows the correlation of values for analogous ortholog groups for various evolutionary statistics computed by zol when different approaches to dereplication are used. See Methods for further details. *To simulate no dereplication, gene-cluster dereplication with re-inflation parameters were used in zol.

