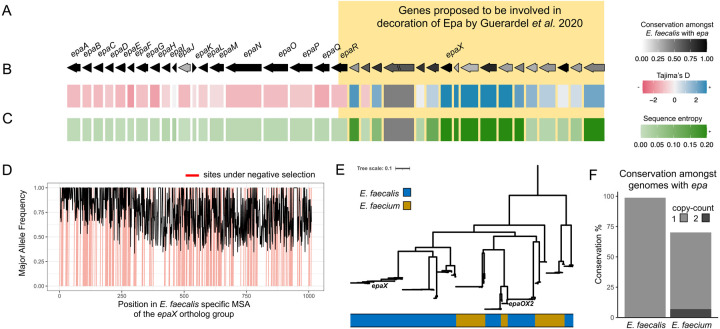
Figure 7: Distribution of the epa locus and associated genes across the genus of Enterococcus.
A) A schematic is shown for the epa locus in E. faecalis for genes which were found in ≥ 25% of 83 representative genomes for the species presented in consensus order with consensus directionality as inferred by zol. The coloring corresponds to the conservation of individual genes. Genes upstream and/or including epaR were recently proposed to be involved in decoration of Epa by Guerardel et al. 2020. “//” indicates that the ortholog group was not single-copy in the context of the gene-cluster. The tracks below the gene showcase their sequence similarity across the E. faecalis genomes measured using (B) Tajima’s D and (C) the average sequence alignment entropy. D) The major allele frequency is depicted across the alignment for the ortholog group featuring epaX. Sites predicted to be under negative selection by FUBAR, Prob(α>β) ≥ 0.9, are marked in red. E) An approximate maximum-likelihood phylogeny based on gap-filtered codon alignments for the ortholog group corresponding to epaX and epaX-like proteins in the joint E. faecalis and E. faecium investigation of the epa locus using zol. F) Conservation of epaX is shown amongst E. faecalis and E. faecium genomes with a high-quality representation of the epa locus available. Coloring of the bars corresponds to the proportion of genomes with a certain copy-count of the epaX-like ortholog group.

