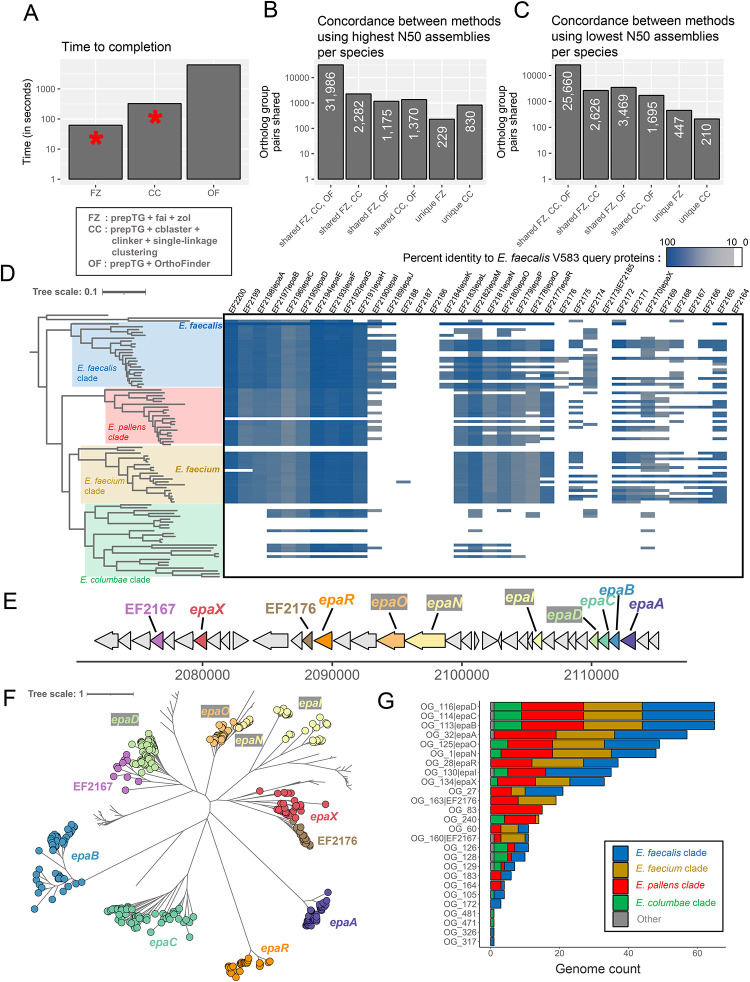
Figure 4: Searching for the epa locus across the diverse genus of Enterococcus.
A) Overview of the time needed to run orthology/homology inference methods on the 92 genomes with the highest N50 for each distinct Enterococcus species. OrthoFinder was run at the genome-wide scale, while fai and cblaster were used to first identify genomic regions corresponding to the epa locus from E. faecalis V583 and subsequently zol and clinker were applied to determine ortholog groups, respectively. The red asterisks denote that manual assessment or filtering of homologous gene clusters identified by fai and cblaster is encouraged and thus additional time might be required for them. Counts showing the overlap in orthologous protein pair predictions by the three different methods are shown following their application to representative genomes from GTDB R214 with the B) highest N50 and C) lowest N50 for the 92 different species. D) The distribution of the epa locus, based on criteria used for running fai, is shown across a species phylogeny for 92 genomes representative of distinct Enterococcus species in GTDB R214. The coloring of the heatmap corresponds to the percent identity of the best matching protein from each genome to the query epa proteins from E. faecalis V583. E) A schematic of the epa gene cluster from E. faecalis V583 (from EF2164 to EF2200) with glycosyltransferase encoding genes shown in color. F) A maximum-likelihood phylogeny of zol-identified ortholog groups corresponding to glycosyltransferases in epa loci across Enterococcus. G) Distribution of different glycosyltransferase ortholog groups across the four major clades of Enterococcus are shown. For D and F the tree scales correspond to the number of amino acid substitutions along the alignments used for phylogeny construction.

