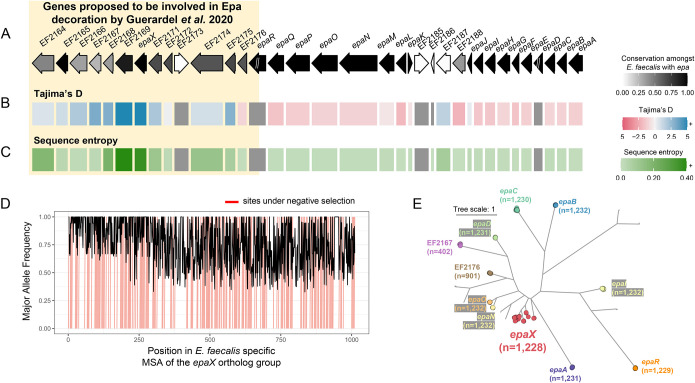
Figure 5: High sequence diversity of epaX-like glycosyltransferases amongst E. faecalis.
A schematic of the epa locus from E. faecalis V583 with evolutionary statistics, A) conservation, B) Tajima’s D and C) sequence entropy, gathered from the best corresponding ortholog group for each protein. Ortholog groups were inferred from zol investigation of 1,232 epa loci from the species. Genes upstream of and including epaR were recently proposed to be involved in Epa decoration by Guerardel et al. 2020. “//” indicates that the ortholog group was not single-copy in the context of the gene-cluster and calculation of evolutionary statistics for these genes was avoided (grey in panels B and C). Note, the same ortholog group was regarded for EF2173 and EF2185 which correspond to an identical ISEf1 transposase. The length of proteins in the locus schematic are the median lengths of the corresponding ortholog groups. D) The major allele frequency is depicted across the alignment for the ortholog group featuring epaX. Sites predicted to be under negative selection by FUBAR, Prob(α>β) ≥ 0.9, are marked in red. E) An approximate maximum-likelihood phylogeny of glycosyltransferase ortholog groups identified by zol which were found in >1% of epa instances. Ortholog groups identified by zol are indicated by colored circular nodes with names of epa genes from E. faecalis V583 noted where possible. The number of leaves/proteins for each clade is provided for labeled ortholog groups. The tree scale corresponds to the number of amino acid substitutions along the input protein alignment used for phylogeny construction.

