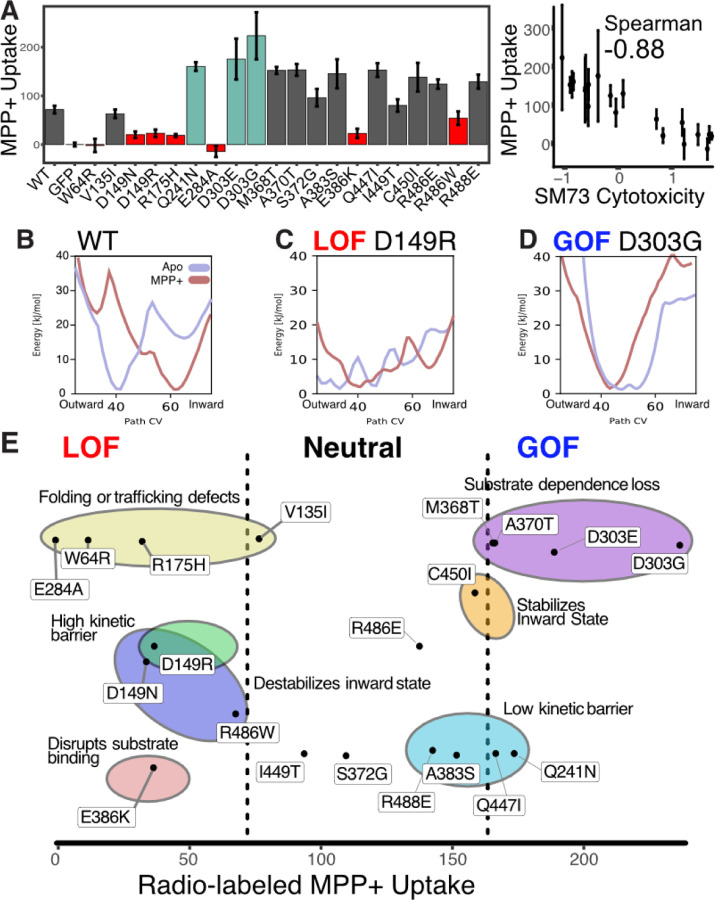
Figure 5. Biophysical basis of mutations on OCT1 function.
(A) Radio-labeled MPP+ uptake experiments for a subset of mutations across a range of fitness mechanisms and effects. Left, mean experimental uptake across 3 replicates (mean with error bars, SEM). Right, correlation between SM73 cytotoxicity fitness scores and radio-labeled MPP+ uptake scores (error bars, SEM), with rankorder Spearman correlation coefficient shown. (B-D) 1D free energy landscapes of the rocker-switch motion for WT, loss of function mutant D149R, and gain of function mutant D303G. Apo landscapes are in light blue and MPP+-bound in light red. (E) Mechanistic basis of mutational impact on OCT1. Mutations are plotted based on their MPP+ uptake scores and classified based on loss of function or gain of function using the high-throughput screen results. Mechanistic classifications inferred from their respective free-energy landscapes (Methods) are grouped within colored circles.

