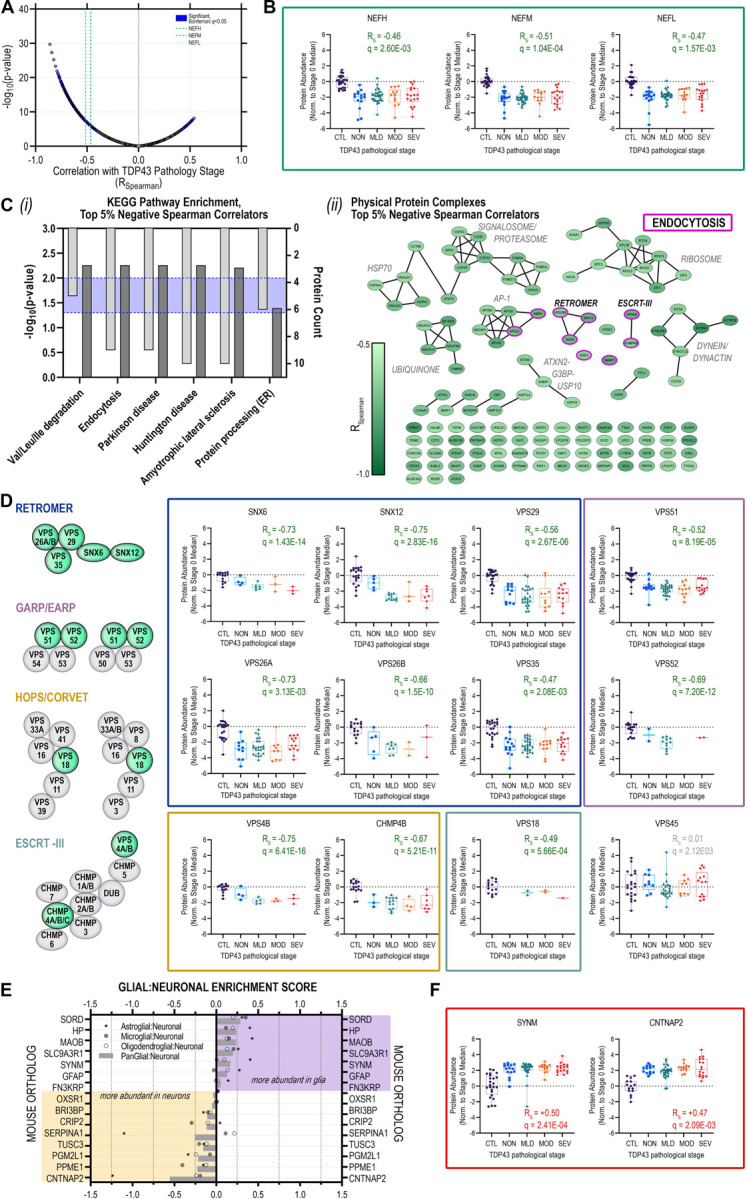
Figure 4. Neurofilament protein and retromer complex component abundances track inversely with increasing TDP-43 aggregation in postmortem human MNs.

(A) Volcano plot of Spearman rank correlations between individual protein abundances per single MN and corresponding TDP-43 stratum; purple highlight, significantly (Bonferroni q < 0.05) correlated proteins; green dashed lines indicate neurofilament protein correlations (heavy (NEFH), medium (NEFM), light (NEFL)) (B) Distribution of protein abundances in individual MNs across TDP-43 strata for neurofilament proteins (NEFH, NEFM, NEFL) (C) (i) KEGG pathways over-represented and (ii) physical protein complexes represented among proteins comprising the top 5% of negative correlators with respect to TDP-43 strata; (D) TDP-43-inclusion-strata-associated protein abundance trajectories for retromer complex components SNX6, SNX12, VPS26A, VPS26B, VPS29, VPS35; GARP/EARP complex components VPS51 and VPS52; HOPS/CORVET complex proteins VPS18; and ESCRT-III complex proteins VPS4B and CHMP4B (E) Glial:Neuronal enrichment scores for proteins significantly positively correlated with increasing TDP-43 inclusion strata determined based on log2-transformed LFQ ratios between individual glial and neuronal populations measured in (Sharma et al., 2015). (F) TDP-43 pathology-associated protein abundance trajectories for the intermediate filament protein SYNM and the presynaptic neurexin protein CNTNAP2. Box plots indicate median ± IQR; whiskers indicate full data range per stage.
