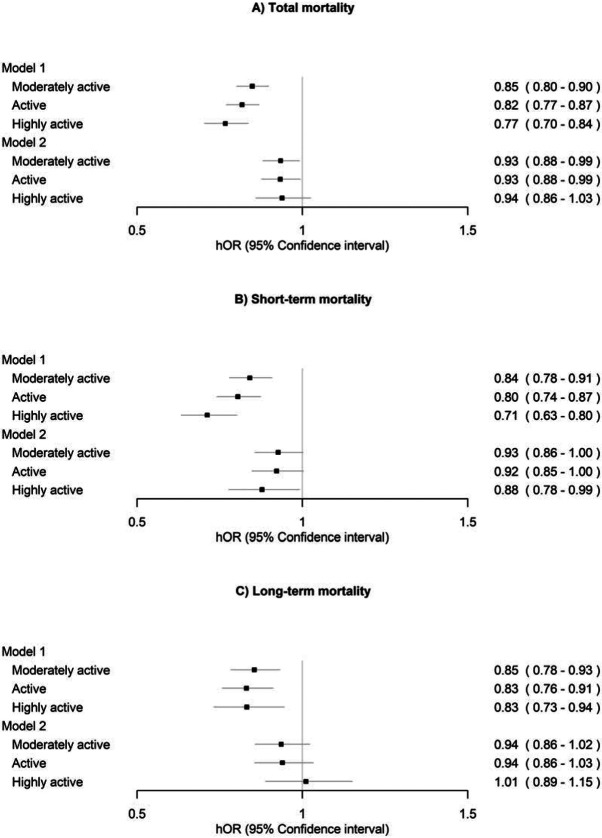
Figure 3.
Associations of long-term leisure-time physical activity with A) total mortality, B) short-term mortality (1990–2011) and C) long-term mortality (2012–2020) (n = 22,750). The sedentary class was treated as the reference. Model 1 was adjusted for sex (female), age and health status. Model 2 was additionally adjusted for education, body mass index, smoking and alcohol use. hOR, hazard odds ratio.

