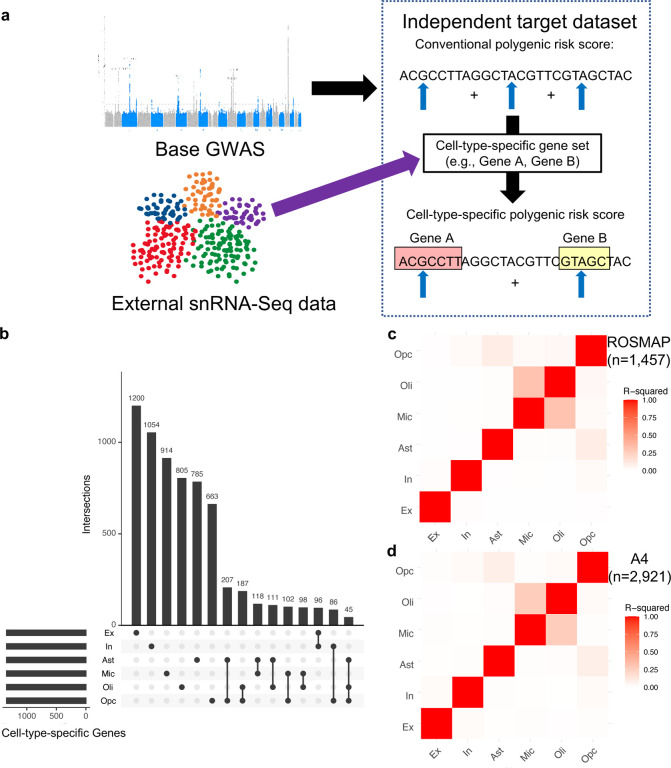
Fig. 1. Cell-type-specific Alzheimer’s disease polygenic risk scores (ADPRS).
a, A schematic of cell-type-specific PRS derivation. b, An UpSetR plot of cell-type-specific gene sets used to define cell-type-specific ADPRS. Each cell-type-specific gene set includes genes within the top 10% of cell-type specificity (n=1,343). Each row of the matrix represents each cell-type-specific gene set, and each column of the matrix represents an intersection of one or more sets. Gene sets in each intersection were indicated by filled black circles connected by a black vertical line. The vertical bar graph on the top shows the number of genes in each intersection. The 15 most frequent intersections were visualized. c-d, Correlation matrix among cell-type-specific ADPRS (c, ROSMAP; d, A4). Pearson’s correlation coefficient was positive for all pairs, and the square of Pearson’s correlation coefficient (R2) between pairs of cell types was visualized.
Abbreviations: Ast, astrocytes; Ex, excitatory neurons; In, inhibitory neurons; Mic, microglia; Oli, oligodendrocytes; Opc, oligodendroglial progenitor cells; snRNA-Seq, single nucleus RNA-sequencing.

