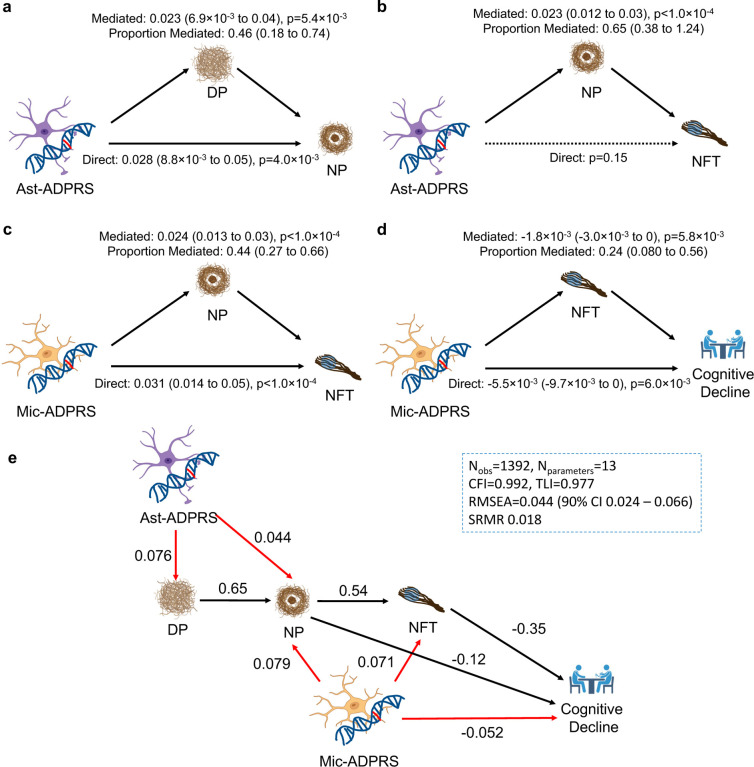
Fig. 3. Causal mediation analyses ans structural equation modeling of cell-type-specific ADPRS and AD endophenotypes.
a, DP partially mediates Ast-ADPRS – NP association (n=1,452). b, NP mediates most of the Ast-ADPRS – NFT association (n=1,474), and the direct effect of Ast-ADPRS on NFT is not significant. c, NP partially mediates Mic-ADPRS – tau association (n=1,474). d, NFT partially mediates Mic-ADPRS – cognitive decline association (n=1,392). The model included NP burden as a covariate. e, Structural equation modeling (SEM) shows a probable causal relationship between cell-type-specific ADPRS and AD endophenotypes. Black solid arrows indicate phenotype-phenotype associations, and red solid arrows indicate genotype-phenotype associations. All depicted associations were nominally significant (p<0.05). Numbers adjacent to each arrow indicate completely standardized solutions (relative strength of the effect). Model fit metrics indicate an excellent model fit. All models in a-e are adjusted for age, sex, education (for cognitive decline slope), APOE ε2 count, APOE ε4 count, genotype batch, and first three genotype principal components. Also see Supplementary Table 14. Abbreviations: CFI, comparative fit index; DP, diffuse plaque; Nobs, number of observations (participants); Nparameter, number of model parameters; NP, neuritic plaque; n.s., not significant; RMSEA, root mean square error of approximation; SRMR, standardized root mean square residual; TLI, Tucker Lewis Index

