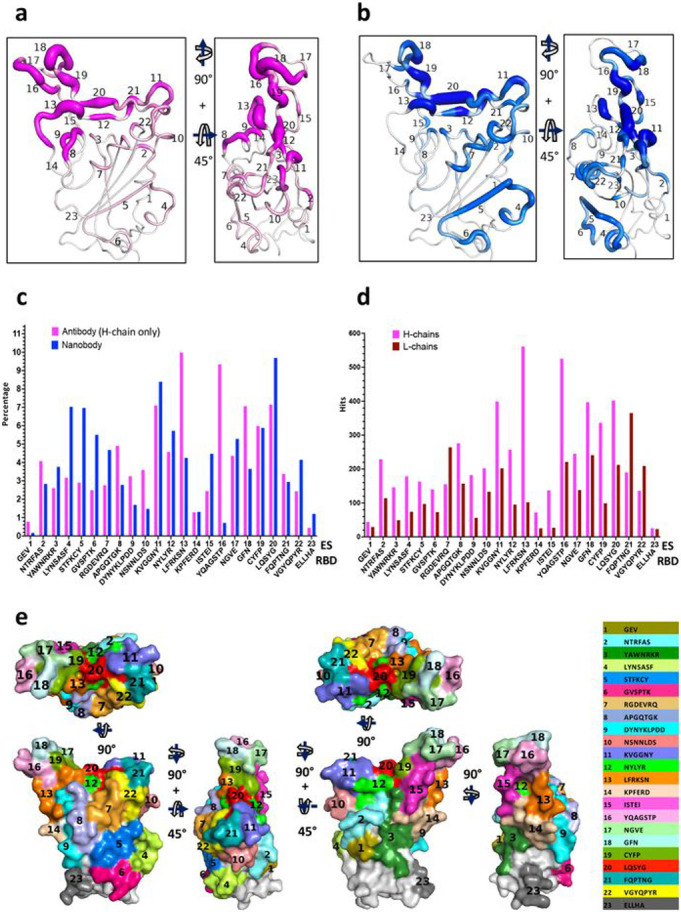
Fig. 2. Distribution of Abs and Nbs on RBD surface.

a Putty heat map of H chain of antibody with the definition of ES. The thickness of putty represents the number of hits. b Putty heat map of Nb with the definition of ES. c Distribution of Abs/Nbs on ES of RBD surface (percentage, %). Magenta represents Ab, blue represents Nb. d Comparison of antibody H chains and L chains on ES of RBD surface (by hit numbers). e ES surface area or footprint is illustrated by a color map of the RBD surface.
