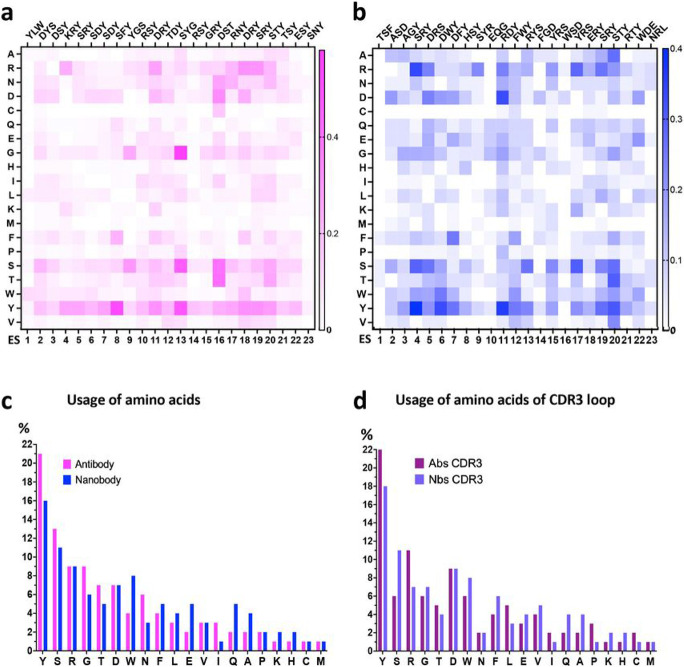
Fig. 4. Distributions of amino acids of Abs/Nbs over ES.
a Heat map of amino acids of Ab H chains on each ES, magenta indicates the frequency of the amino acids. b Heat map of amino acids of nanobody on each ES, blue indicates the frequency of the amino acids. Top triplets of amino acids are those most frequently observed amino of Abs/Nbs on each ES. c The usage of amino acids of antibody H chains (magenta) and nanobody (blue) in interacting with RBD is plotted in descending order (percentage). YSR are most frequently observed amino acids both for Ab and Nb. d Usage of amino acids in CDR3 loops (purple for Abs; light blue for Nbs). W of Nbs has relatively higher percentage in comparison to Abs both overall and for CDR3 loop.

