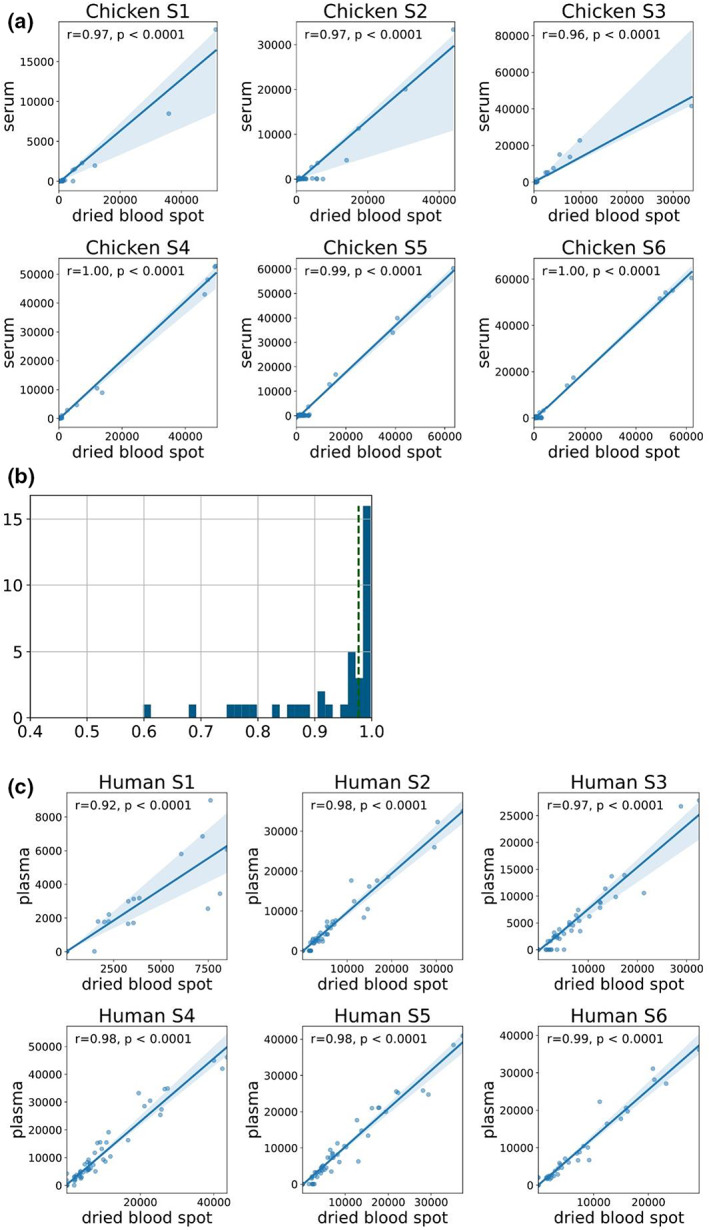
Figure 4.

Antibody profiles of dried blood spots are highly correlated with those measured from serum or plasma. Chickens were vaccinated with an H9N2 influenza vaccine two times, and blood samples were collected 34 days after the first vaccination (n = 16) or 30 days following the second vaccination (n = 20). Serum and dried blood spots were collected from each blood sample. The immunoglobulin (Ig) Y response to vaccination was profiled using an antigen microarray spotted with recombinant influenza proteins from 15 influenza A and B subtypes (see Supplementary table 2). Data from one representative experiment of two experiments are shown. (a) Scatter plots of the median fluorescent intensity (MFI) for each serum–blood spot pair are presented for six chickens. Each dot represents the MFI to a single antigen as measured by dried blood spot (x‐axis) and serum (y‐axis). The Pearson correlation was computed for each pair. Samples S1 and S2 are from 41‐day‐old female chicks, samples S3 and S4 are from 2.5‐month‐old male chickens and samples S5 and S6 are from 3‐month‐old female chickens. (b) The distribution of Pearson correlation coefficients of the 36 serum–blood spot pairs. The dotted green line represents the median r value of 0.977. (c) Dried blood spots and plasma samples were also collected from six human adults that were previously vaccinated with the Pfizer severe acute respiratory syndrome coronavirus 2 (SARS‐CoV‐2) vaccine. The scatter plots of the IgG responses to a human SARS‐CoV‐2 antigen microarray (Supplementary table 3). Each dot represents the MFI to a single antigen as measured by dried blood spot (x‐axis) and plasma (y‐axis). The Pearson correlation coefficient and P‐value are presented for each individual.
