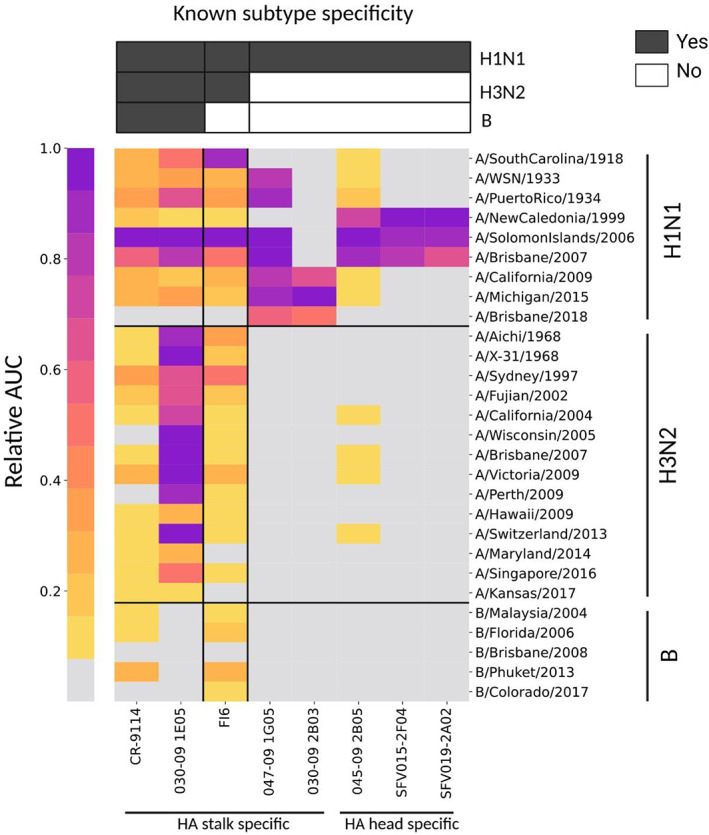
Figure 8.

Rapid profiling of a panel of human monoclonal antibodies (hmAbs) using FLU‐LISA. A panel of eight representative influenza hemagglutinin (HA) hmAbs (Supplementary table 6) were profiled using traditional FLU‐LISA against a panel of A/H1N1, A/H3N2 and B influenza recombinant HA proteins (hmAb antigen microarrays; Supplementary table 1). The hmAbs included five HA stalk‐specific antibodies and three HA head‐specific antibodies. Each hmAb was run at three dilutions: 6, 1.5 and 0.375 μg mL−1, and the area under the curve (AUC) was computed for each antigen separately. Responses of each hmAb were normalized to its maximal AUC value across all antigens. Colors denote the normalized AUC scores for each hmAb to each of the antigens, with darker colors representing higher normalized AUC values. Gray represents normalized AUC values < 0.05. Each of the eight hmAbs was previously characterized using ELISA against specific H1, H3 and B HA antigens, as summarized on the top bars (dark gray cells). FLU‐LISA, fluorescence‐linked immunosorbent assay.
