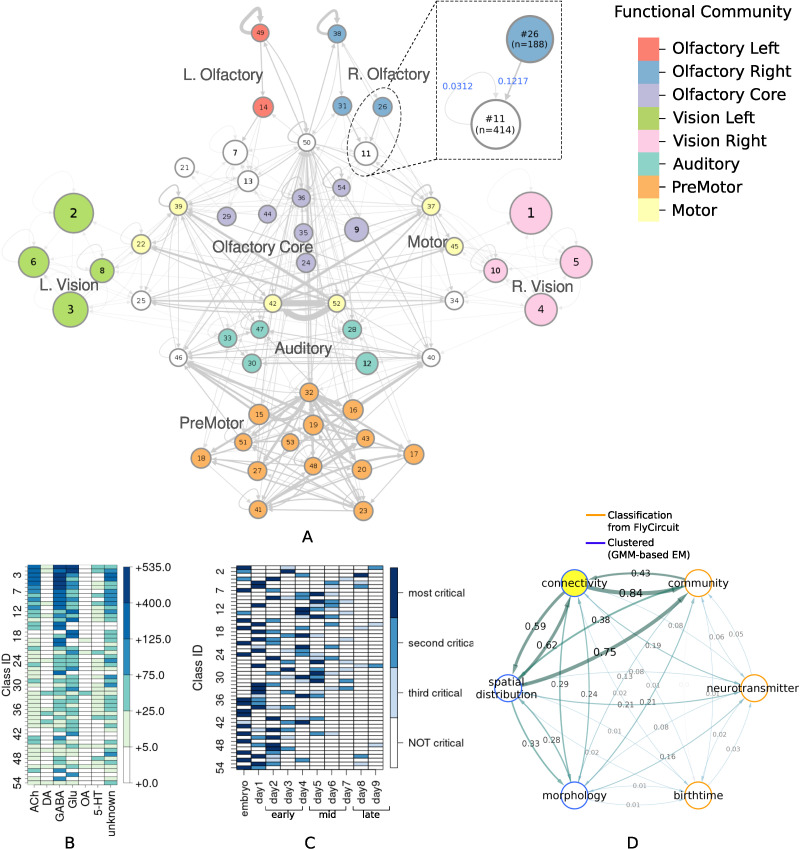
Figure 1. .
(A) Circuit diagram of 54 connectivity-based cell classes. The size of each node is proportional to the number of neurons in that cell class, while the edge thickness is proportional to the directional connection probabilities. Classes are color-coded by their dominant functional community as reported in FlyCircuit.tw (Shih et al., 2020). (B) Distribution of neurons in the 54 connectivity-based classes by neurotransmitter. ACh: acetylcholine; DA: dopamine; GABA: gamma-amino-butyric acid; Glu: glutamate; OA: octopamine; 5-HT: serotonin. (C) Mapping of connectivity-based classes by periods of critical of growth (embryo, early, mid, late), identified by the developmental birthtimes of constituent neurons. (D) Normalized mutual information among six classification schemes. A value of 1 indicates the two classifications are identical, while 0 indicates that they are independent.

