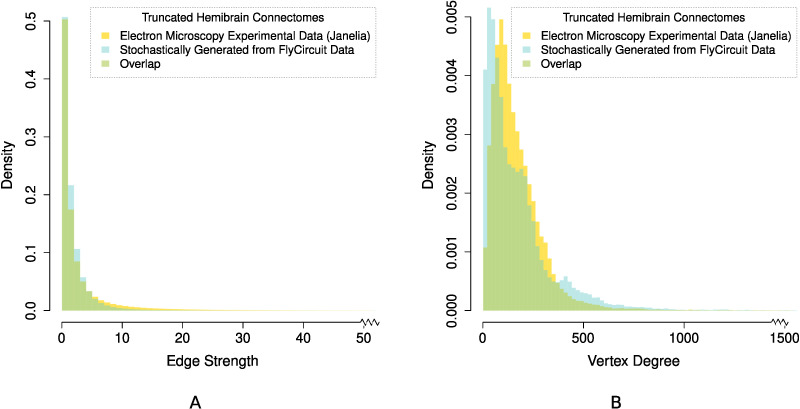
Figure 3. .
Normalized histogram distributions (probability density functions) of the (A) edge strength, and (B) vertex degree, comparing the experimentally determined Janelia hemibrain connectome (Scheffer et al., 2020) against our stochastically generated connectome using pconn = 0.15. Both connectomic datasets were appropriately resized so that they span the exact same neuropils in the Drosophila hemibrain.

