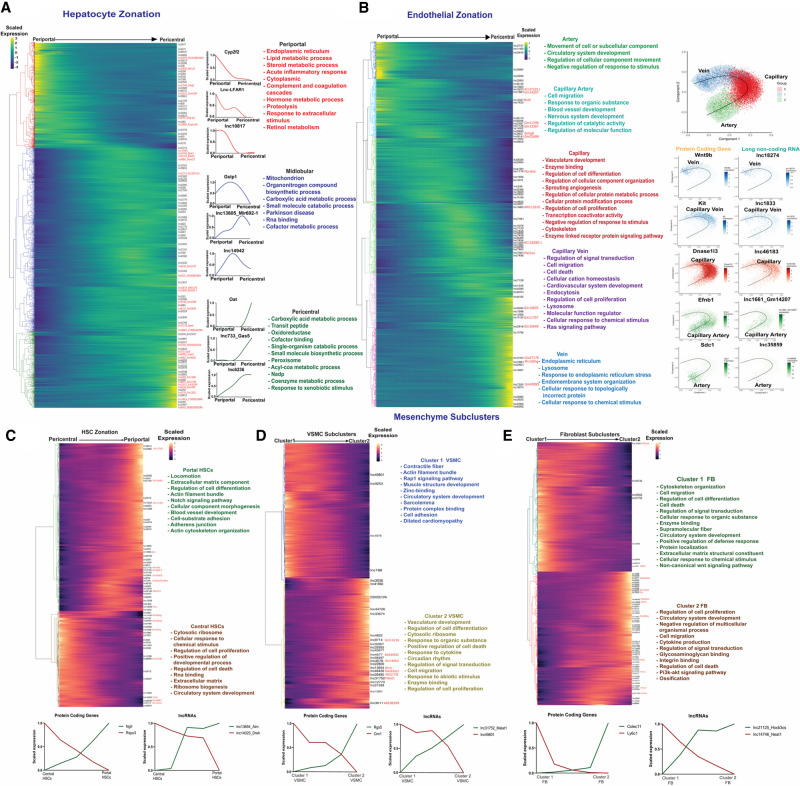
FIGURE 3.
LncRNA zonation across healthy liver lobule. (A) Heatmap showing relative expression of PCGs and lncRNAs that are zonated in hepatocytes, ordered from periportal (left) to pericentral (right), with each row corresponding to one gene, as marked at the right for lncRNAs. Right of heatmap: Zonation profiles for select genes, along with top enriched terms for each of the three main hepatocyte zones. Font color for enriched terms matches the dendrogram color at the left of heatmap. (B) Heatmap showing zonated expression profiles for PCGs and lncRNAs that are zonated in endothelial cells, with clusters matching gene trajectories sequentially, from artery to capillary artery, capillary, capillary vein, and finally vein, with cluster assignments based on known spatial marker genes (see text). Top functional enrichment terms of each cluster (colored) are at the right. Further to the right are Scorpius pseudotime trajectories showing endothelial cell phenotypes along the artery-capillary-vein axis, with trajectory plots for select marker genes and mouse liver lncRNAs displayed across the pseudotime trajectory. (C–E) Heatmaps showing expression trajectories for PCGs and lncRNAs that are apparently zonated in the hepatic mesenchyme, which is comprised of HSCs (C), VSMCs (D) and fibroblasts (E), with top enriched terms and select marker genes as shown.

